
Figure 1.
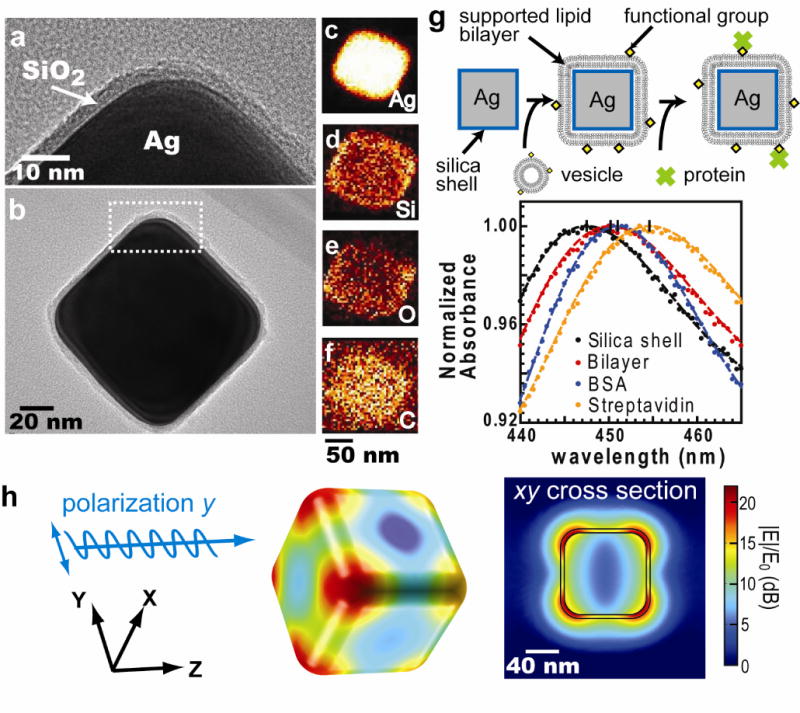
The physical properties of Ag@SiO2 core-shell nanocube. (a) & (b) TEM images of Ag@SiO2 nanocube. (a) is the close-up image of figure (b). (c)~(f) The elemental maps obtained by high-angle annular dark field scanning TEM (HAADF-STEM) with energy dispersive x-ray spectroscopy (EDS). (c) to (f) represent silver, silicon, oxygen, and carbon, respectively. (g) Top: Detection procedure of nanocube sensors. Supported lipid bilayers are formed by vesicle fusion onto the silica surface, and protein binding is monitored by shifts in the LSPR extinction spectrum. Bottom: Typical spectra of membrane coverage and protein binding to the membrane surfaces. Sequential addition of lipid vesicles, BSA, and streptavidin causes LSPR red shifts. (h) Electric field norm (|E|/E0) in decibel (dB) of a nanocube at resonance (n = 1.33303, λ0 = 474 nm) computed using finite-element analysis.