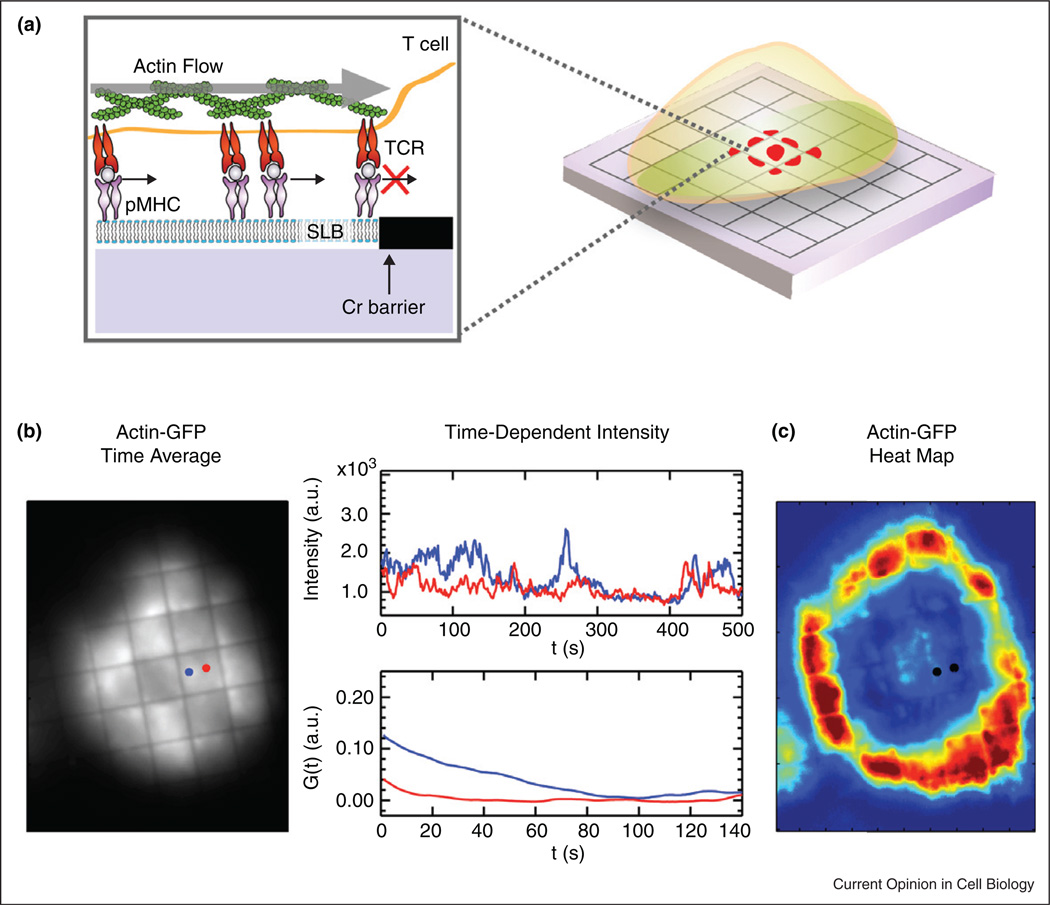
Figure 3. Measuring TCR–actin interactions.
(a) Schematic of a T cell on a substrate patterned with diffusion barriers. (b) Left, Time average of a stack of fluorescent actin-GFP. Right, Trace and plots illustrate temporal fluctuations along with time correlation, G(τ). (c) Pixel by pixel image of autocorrelation times reveals regions of high actin volatility and stability.

