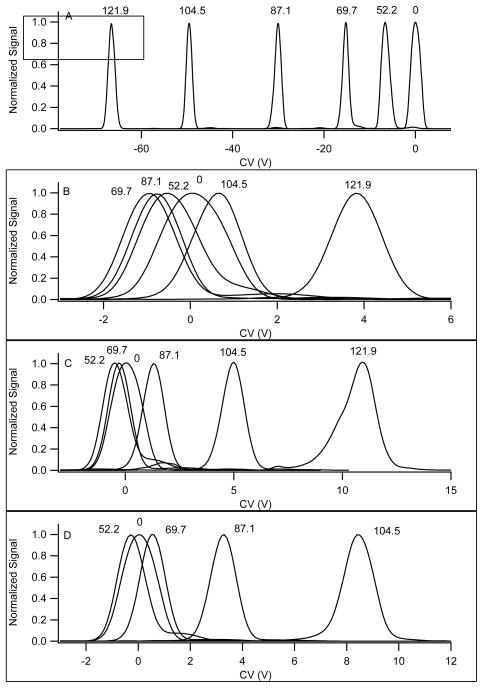
Figure 8.
Methylhistamine data under 4 different transport gas conditions. The conditions are A) nitrogen with 1.5% 2-propanol, B) nitrogen, C) nitrogen with 28% helium, and D) nitrogen with 37% helium. Note that different scales are used for each figure. The separation field (Td units) corresponding to each peak is displayed in each pane. The data are normalized to more clearly illustrate peak positions. With increasing helium fraction in the transport gas there was a significant reduction in signal at the highest separation voltages, with complete elimination of the peak demonstrated in pane D when the SV was 3500 V.

