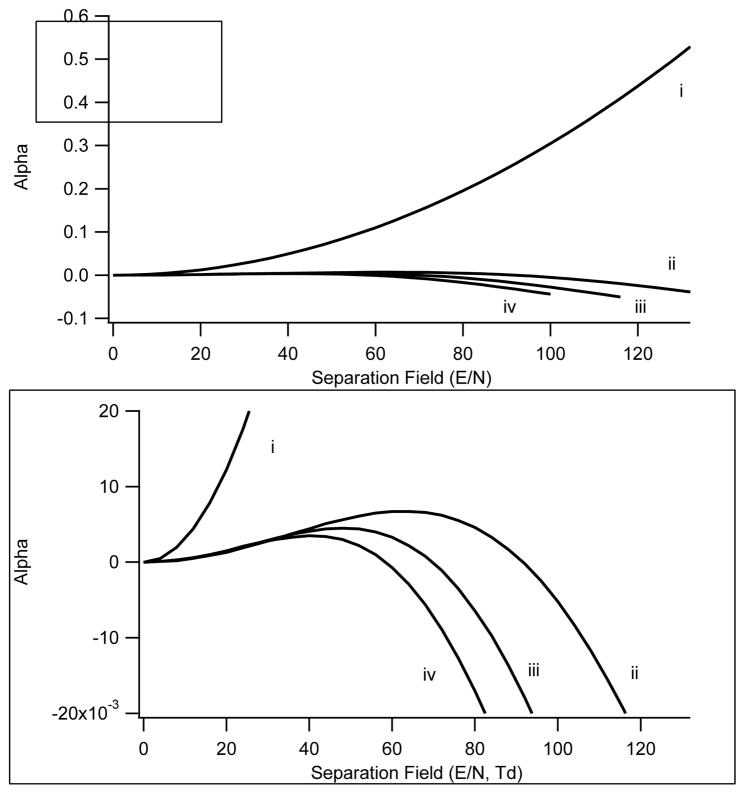
Figure 9.
Alpha curve plots for methyl histamine under 4 different transport gas conditions. i) Nitrogen with 1.5% 2-propanol, ii) nitrogen, iii) nitrogen with 28% helium, and iv) nitrogen with 37% helium. The bottom pane shows an expansion along the Y axis to more clearly demonstrate the Type B behavior in the absence of modifiers.

