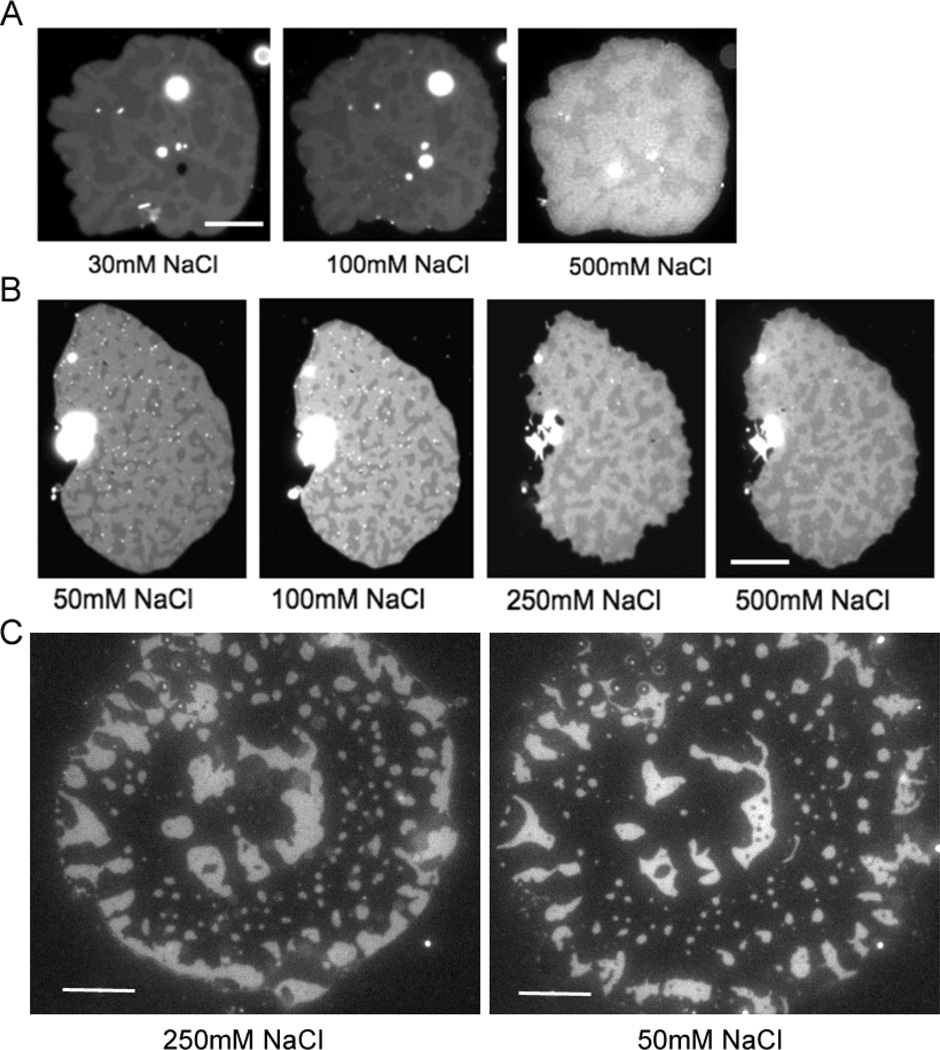
Fig. 4.
Pattern change with salt concentration. (A) A patch containing 1:1 ratio of 24mer (repeating sequence, bright region) and 48mer (overlapping sequence, dark region) was imaged by FLIC on 260 nm SiO2 visualizing TR-labelled lipid. The pattern change was monitored with varying NaCl concentration. The contrast of the 500 mM picture was enhanced to compensate for photobleaching. (B) A patch contains 1:1 ratio of 24mer (overlapping sequence, dark region) and 48mer (overlapping sequence, bright region) and was imaged by FLIC on 380 nm SiO2. (C) The pattern change with decreasing salt from 250 mM to 50 mM NaCl was monitored by Alexa 488 labelled poly24A. The patch contains 1:1 ratio of 24mer and 48mer and was imaged by normal epi-fluorescence microscopy. Because the 250 mM image was captured when the patch is still spreading, the edge of patch became expanded in the 50 mM image. Scale bar is 10 µm.

