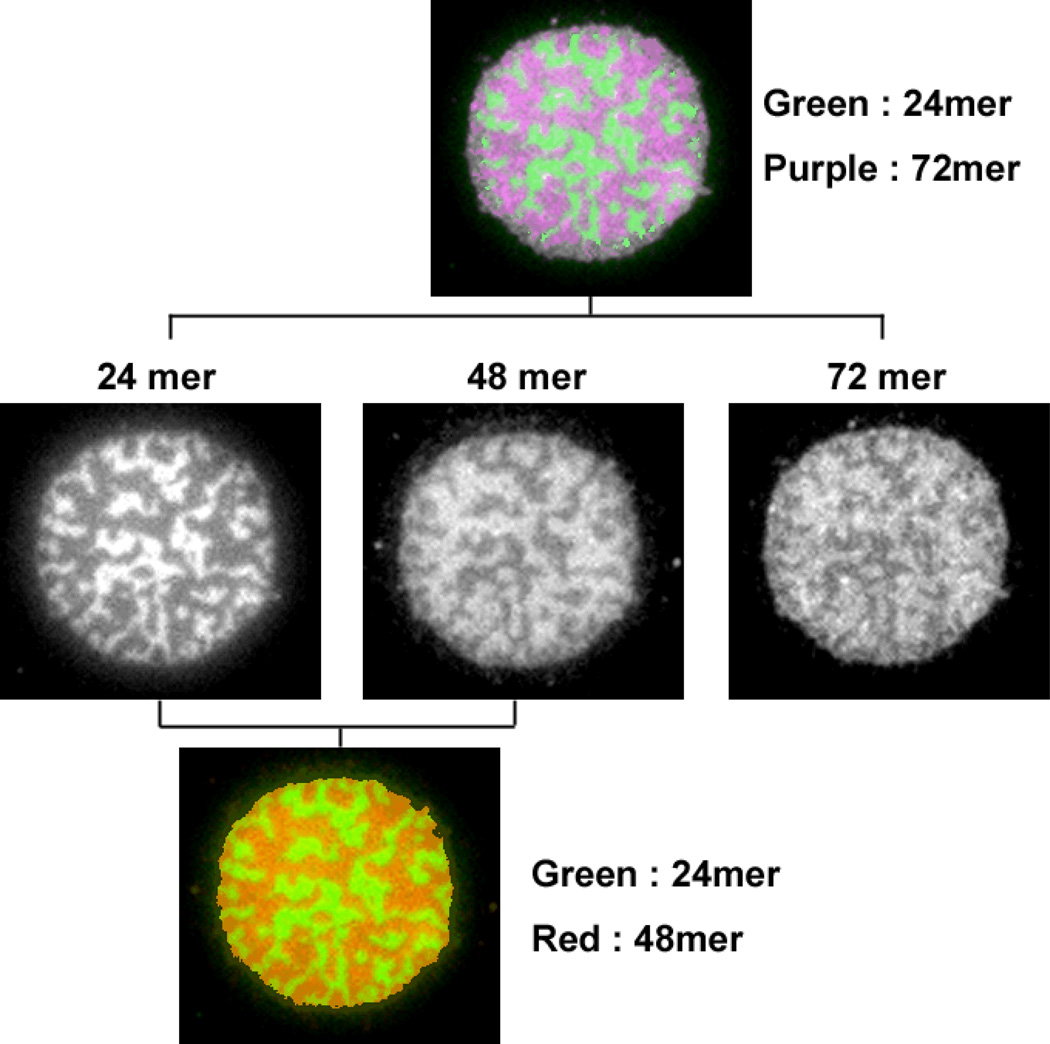
Fig. 6.
A patch with three different lengths of DNA that are labelled by fluorescence dye. Each DNA occupied regions imaged by corresponding fluorescence is shown for side-by-side comparison. Alexa 488 labelled 24mer is shown with green colour, and Cy5 labelled 48mer is red, and Cy3.5 labelled 72mer is purple in the overlay image.

