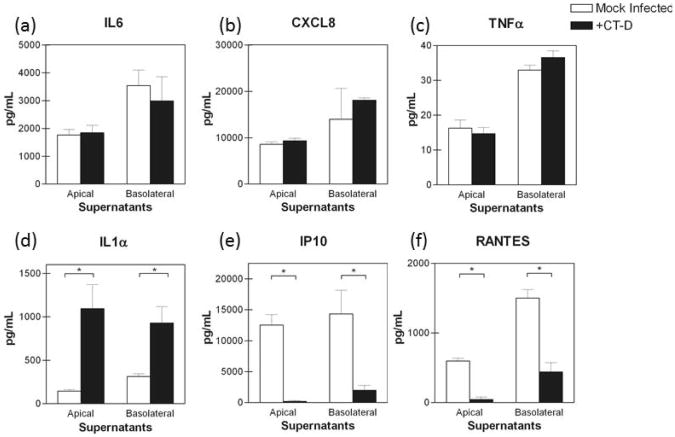
Figure 3. C. trachomatis fails to elicit a robust pro-inflammatory cytokine response and decreases T cell chemokine secretion in polA2EN cells.
PolA2EN cells were infected with C. trachomatis serovar D (>95% infection rate). Apical and basolateral supernatants were subjected to cytometric bead array analyses for (a) IL6, (b) CXCL8, (c) TNFα, (d) IL1α, (e) IP10, and (f) RANTES. Graphs shown represent the 72 hours post-infection; cytokine values represent mean values ± SD. Graphs shown are representative graphs from 3 independent experiments each performed in triplicate. Statistical analyses between mock infected and C. trachomatis infected parameters were performed using a One-way ANOVA (*p<0.001).

