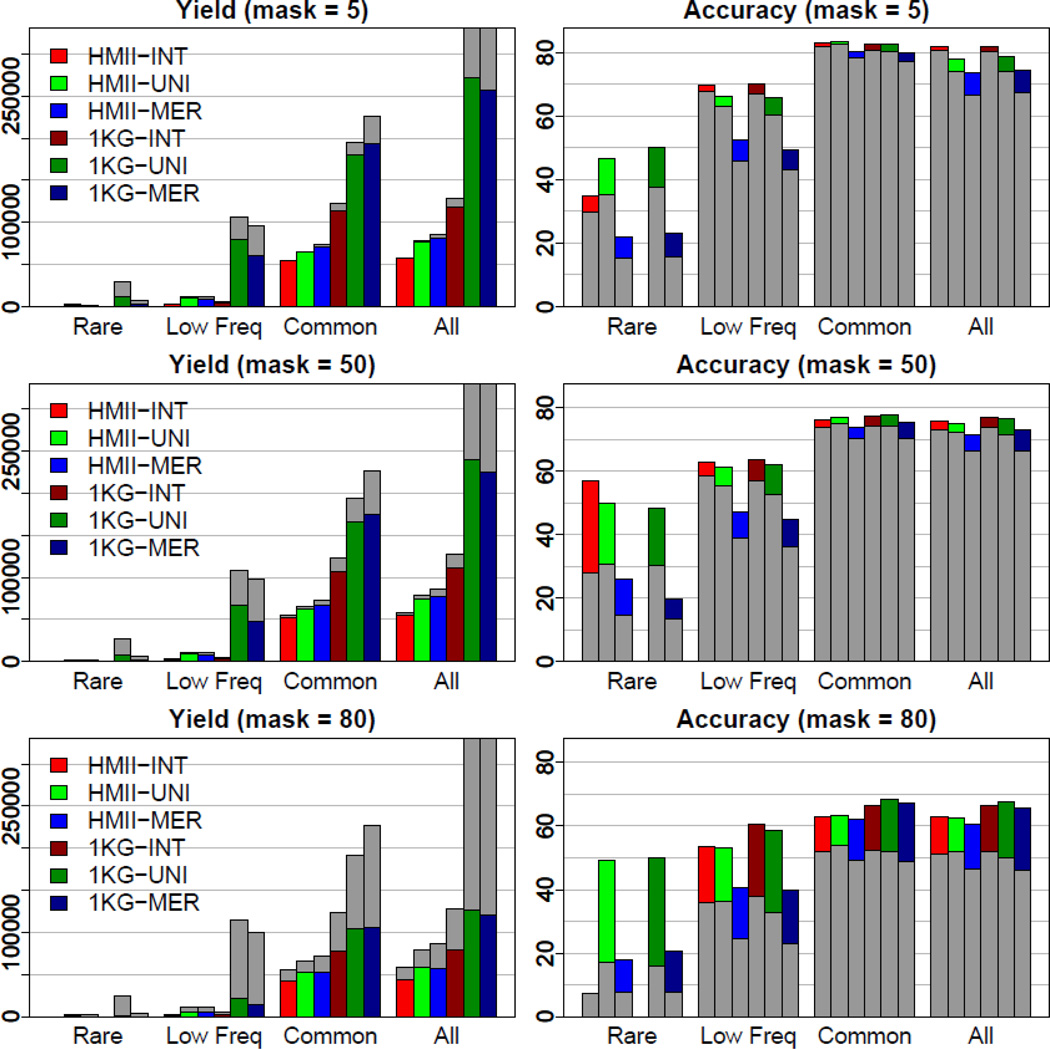
Figure 3.
Imputation yield (left) and accuracy (right) using filtered SNPs across the MAF spectrum for all three masked data using panels from both the HapMap II (HMII) and 1000 Genomes (1KG) Projects. Gray bars show total number of imputed SNPs (left) and accuracy rates (right) using all imputed SNPs.

