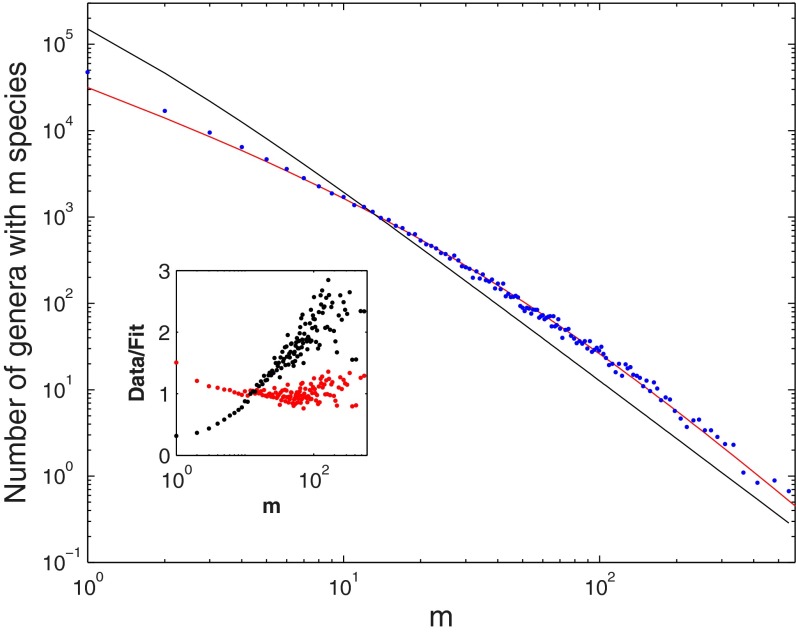
Fig. 1.
The SGD statistics for the kingdom Animalia. The graph shows the number (n) of genera with m species on a double logarithmic scale (Pareto plot) with logarithmic binning (SI Appendix). The solid black line is the best fit of Yule’s model (Eq. 1) to the data, for which ν = 0.2 (3). This value was obtained by a least squares fit (distance has been measured in logarithmic units), where ν is a free parameter. The solid red line is the best fit of the SEO model (Eq. 4), with a diversification (speciation minus extinction) rate of γ = 0.063 ± 0.0032 and the probability of origination of a new genus (on speciation) of ν = 0.026 ± 0.001. The confidence intervals were obtained from a parametric bootstrap (more details in SI Appendix). A nonparametric bootstrap leads to confidence intervals about one-half the size. The slight deviations for m = 1 reflect the inadequacy of the continuous theory in this regime as explained in the text. Using Monte Carlo simulations, we can get estimates for the case m = 1 (Table 2). In the inset, we present the ratio between the observed statistics and the models’ predictions as a way to assess the models’ validity. A valid model should present a random distribution of the ratios around one, whereas an invalid model will present a trend. Yule (3) was aware of this problem and added two more parameters that improved the fit to the data, but these parameters obscured the underlying process. A discussion of this topic is in SI Appendix.

