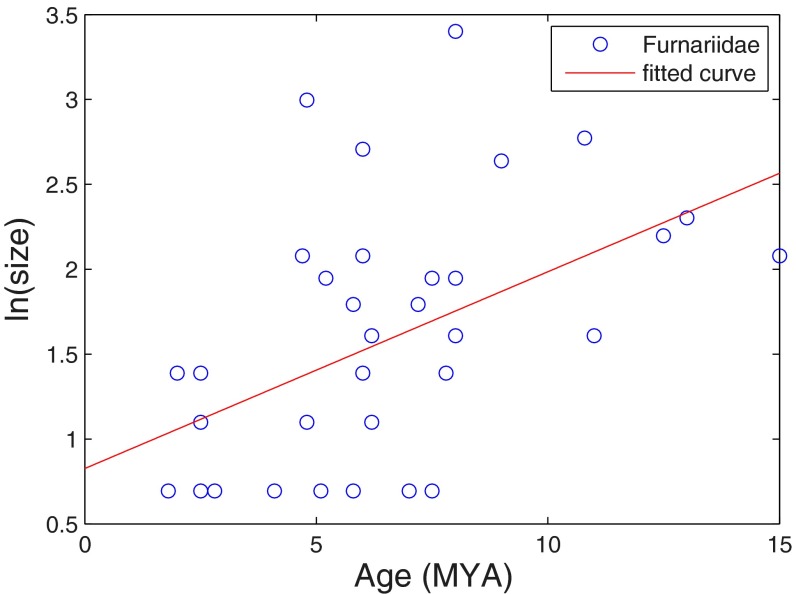
Fig. 3.
The correlation between the age of a genus and its size is presented. The x axis is the crown age of a genus as estimated in the work by Derryberry et al. (32). The y axis is the log (base e) of the size of the genus. The red line is the linear fit of the data that corresponds to exponential growth. The result is consistent with the SEO model that predicts an exponential growth. The slope of the linear fit is 0.047 (0–0.095) per million years. Assuming a species generation time of 2.1 My, the slope is 0.099 (0–0.2), which is similar to the result that we get below for the passerine birds.

