
Fig. 4.

Semilog (number of species) vs. time for unbounded (red) and constrained (blue) growth. During stage 1 (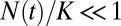 ), both constrained and unconstrained systems increase exponentially. During stage 3 (
 ), the system is no longer growing (
 ). After a period, the system will attain SEO steady state during both stages. Only during the transitional stage 2 will the system deviate significantly from the predictions of the SEO model.