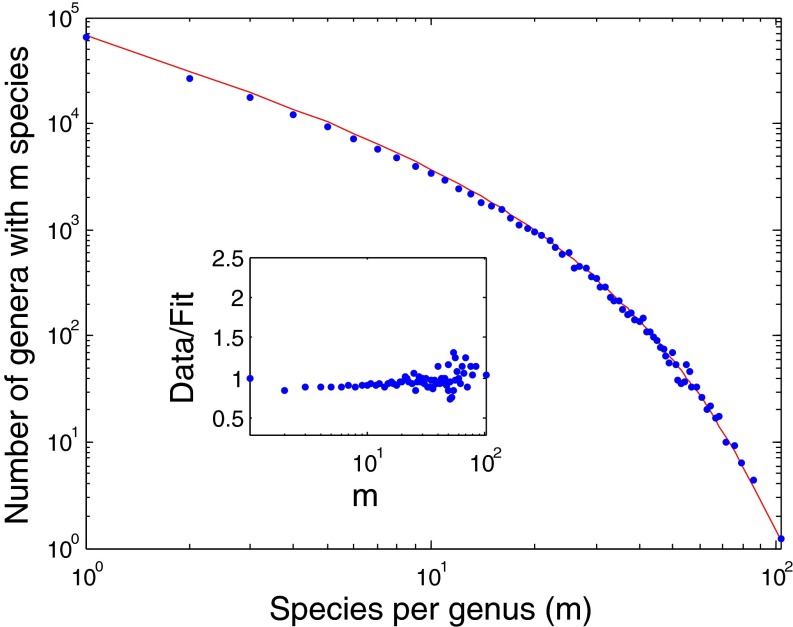
Fig. 6.
Same as Fig. 5 for stage 3. Here, the system was sampled 100 generations after saturation had been reached. The inferred parameters are γ = 0.001 (very close to zero) and ν = 0.039. Note that ν > γ, and therefore, Eq. 5 was used to fit the simulated data. In the inset, we present the ratio between the observed statistics and the model's predictions, as was done in the inset of Fig. 1.

