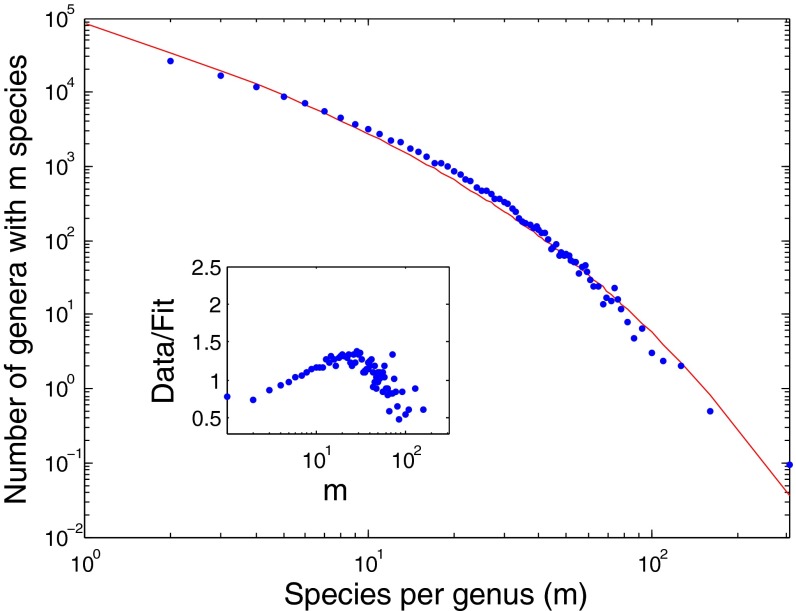
Fig. 7.
Same as Fig. 5 for stage 2. The system was sampled 30 generations after saturation [i.e., after N(t) is more than 95% of K, the carrying capacity of the logistic process] before reaching the  equilibrium. Instead, the fit yields
  and
and  . The inset shows the systematic deviations of the fit/data ratio and indicates the inadequacy of the model in this case.

