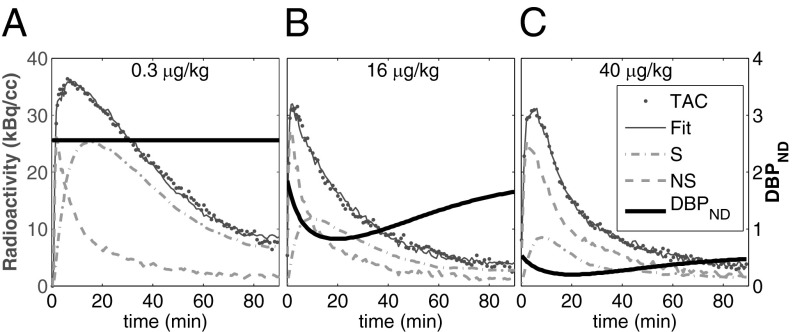
Fig. 2.
(A–C) PET TAC for whole putamen in M1 (dots) for the lowest-mass dose (A) and the two highest masses (B and C) with fit to the data (solid lines). DBPNDs (Eq. 3) (shaded lines), together with SRTM estimates of nonspecific (NS = R1CREF) or specific binding (Ŝ = CT – R1CREF) are displayed over time. Dynamic binding analyses demonstrated an improved fit to data.

