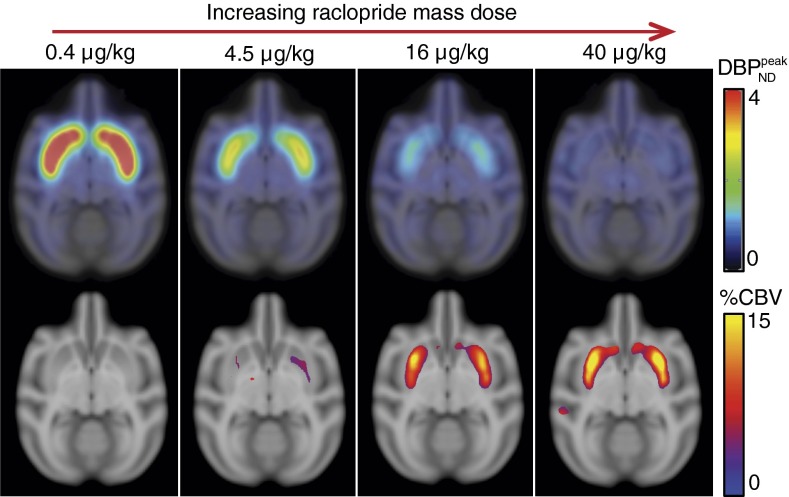
Fig. 4.
(Upper)  parameter maps from PET data, overlaid on an anatomical MR atlas. (Lower) Maps of %CBVpeak change from fMRI data, windowed by a P-value map with P
 0.03. All maps are created from data from two animals with a mixed-effects model. Similarities in the spatial distribution of PET/fMRI signals and the dose dependencies support the idea that antagonism of RAC at D2/D3R is elicited by the CBV changes.

