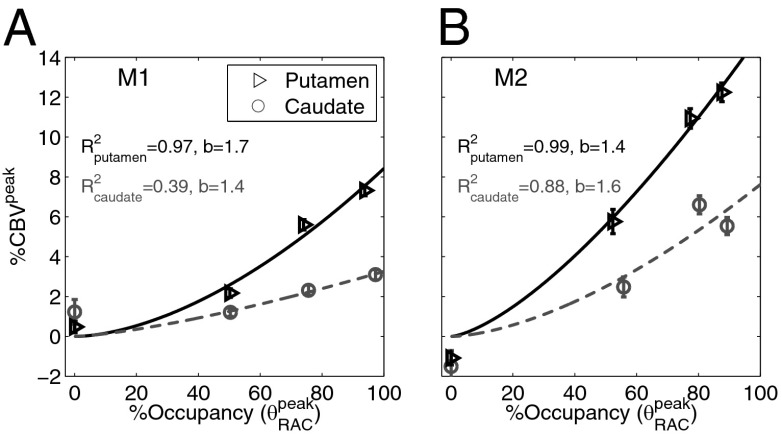
Fig. 5.
(A and B) %CBVpeak vs. occupancy can be approximated by a power-law fit (with exponent b) for putamen and caudate ROIs for M1 and M2. Data show a monotonically increasing relationship, with putamen exhibiting approximately twice the CBV magnitude compared to caudate. Error bars show within-session uncertainty from the GLM analysis and SEM for repeated fMRI studies with the lowest RAC mass dose.

