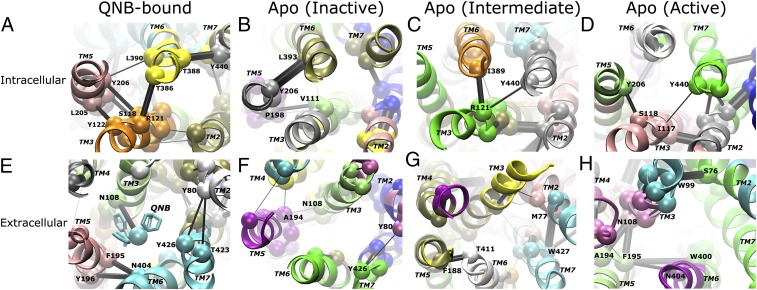
Fig. 3.
A highly dynamic network is identified in the M2 receptor through community network analysis. Intracellular views of the G-protein-coupling site for the QNB-bound form (A) and the apo form in inactive (B), intermediate (C), and active (D) states are shown, and the corresponding extracellular views of the ligand-binding site are shown in E–H. The receptor exhibits significant differences in its allosteric network between the QNB-bound form and the inactive, intermediate, and active states of the apo form. Notably, the network strength between communities in the intracellular domains is greatly weakened during activation of the apo receptor. Network communities are colored separately by their ID number; critical nodes located at the interface of neighboring communities are rendered as spheres and labeled by residue number; and the connecting edges are represented by black lines with their width weighted by betweenness, the probability of information transfer between communities. The TM helices are labeled in italics.

