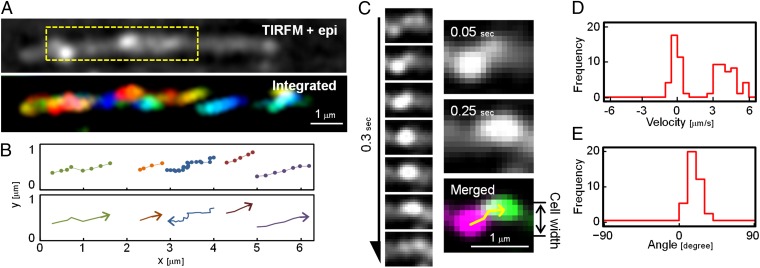
Fig. 3.
Left-handed helical flow of SprB on the cell surface. (A) Location of SprB observed by TIRF microscopy (TIRFM). A cell translocating to the right was analyzed. Cell outline was visualized by simultaneous weak illumination using a halogen lamp. The SprB signals were colored from red to blue at 0.05-s intervals for 1.25 s and integrated into one image (Lower). The image is the view from the glass side. The images come from Movie S4. (B) Traces of typical SprB signals (Upper). Each signal was dotted with 0.05-s intervals. The same cell as shown in A was used. The moving direction of each trace is indicated by the arrows (Lower). (C) Tracking of typical signals. (Left) Montage of signals at 0.05-s intervals for 0.3 s. (Right) The images at 0.05 s and 0.25 s were colored magenta and green, respectively, and merged into a single image. Tracking of the signal is represented by the yellow arrow. (D) Velocity of SprB signals. The velocities of 72 signals were calculated from the x-axes of the fitting line and integrated into a histogram. (E) Angle of SprB signal traces. The angles of the fitting lines of the traces of 39 SprB signals moving from lower left to upper right with respect to the x-axis were measured and integrated into a histogram. SprB signals displaying well-separated foci were used for calculations.

