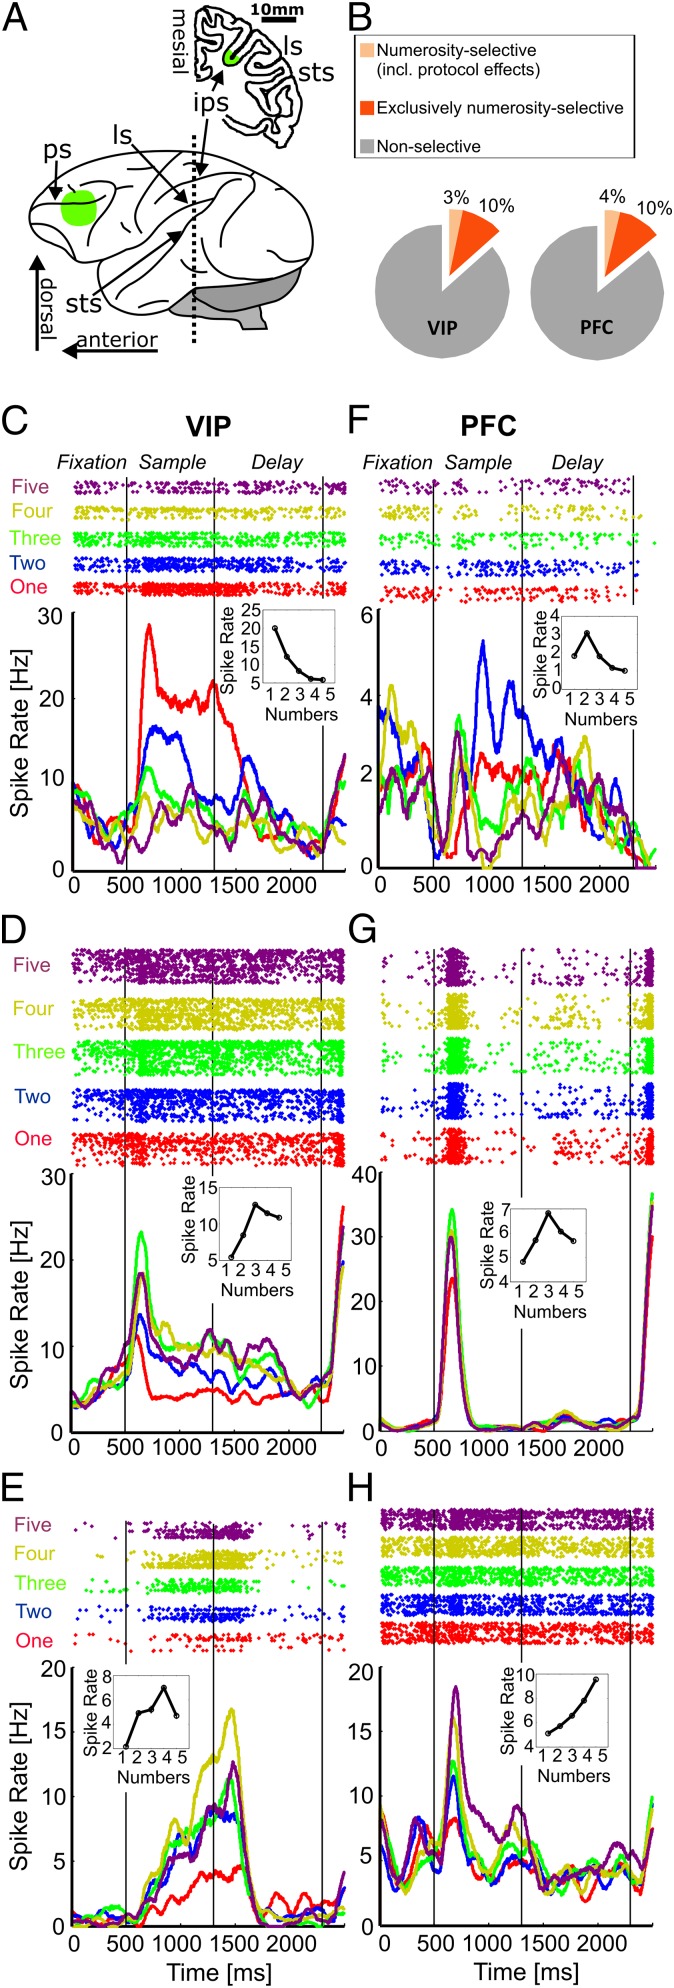
Fig. 2.
Recording sites and neural responses to numerosity. (A) Lateral view (Lower) of the left hemisphere of a monkey brain indicating the topographical relationships of cortical landmarks. Coronal section (Upper) at the level of the dotted line in the lateral view reconstructed from a structural MRI scan (Horsley-Clark coordinates 0 mm anterior/posterior). Green regions on the frontal lobe and in the fundus of the IPS mark the recording areas in the PFC and area VIP, respectively. LS, lateral sulcus; PS, principal sulcus; STS, superior temporal sulcus. (B) Pie chart depicting the absolute proportions of numerosity-selective neurons found in areas VIP and PFC. (C) Responses of an example VIP neuron selective to the numerosity one. (Upper) Dot-raster histograms (each dot represents an action potential); (Lower) averaged spike density functions (activity averaged and smoothed by a 150-ms Gauss-kernel). The first 500 ms represent the fixation period. Colors of dot histogram and spike density functions correspond to the number of items in the sample displays. (Inset) The neuron’s tuning function, the discharge rates as a function of the number of items. (C–E) Example VIP neurons tuned to numerosities one, three, and four (layout as in C). (F–H) Example PFC neurons tuned to numerosities two, three, and five (layout as in C).

