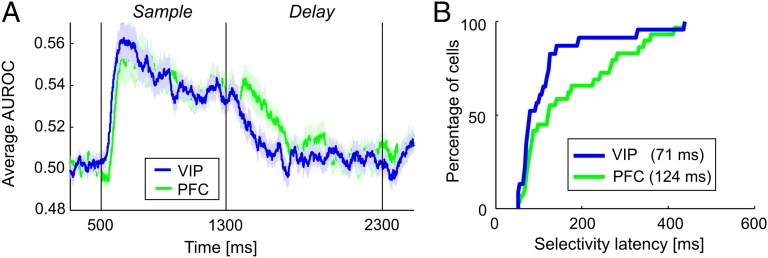
Fig. 4.
Time course of VIP and PFC numerosity selectivity. (A) The time course of numerosity selectivity across numerosity-selective VIP and PFC populations was determined by a sliding ROC analysis. AUROC values of 0.5 indicate complete indiscriminability of the best and least preferred numerosities; AUROC values larger than 0.5 indicate stronger neuronal activity to the preferred numerosity. (B) Cumulative latency distributions across all neurons that showed significant numerosity selectivity after sample onset according to the sliding ROC analysis revealed the fraction of VIP and PFC neurons that had become numerosity selective by each time point. Shading indicates SEM.

