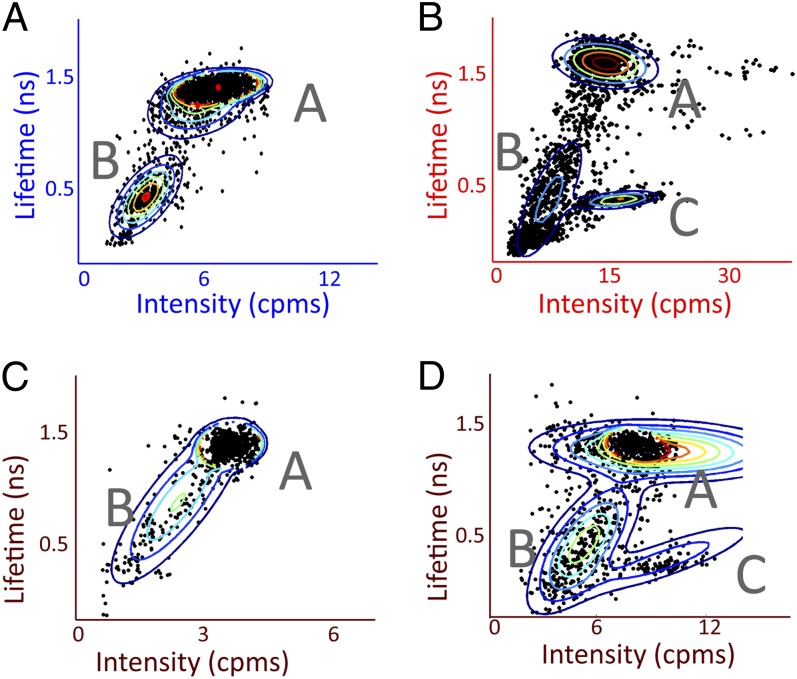
Fig. 2.
Correlations between intensity and lifetime reveal three states of LH2. Fluorescence lifetime-vs.-intensity plots in which each period of constant intensity is represented as a ● and clusters are identified by a Gaussian mixture model, shown by the rainbow lines at 10% contour intervals for four different combinations of excitation wavelength and fluence: (A) 515 nm, 18.1 μJ/cm2 per pulse; (B) 805 nm, 41.7 μJ/cm2 per pulse; (C) 840 nm, 2.4 μJ/cm2 per pulse; and (D) 840 nm, 18.4 μJ/cm2 per pulse. All combinations show states A and B, and state C appears with higher excitation fluence.

