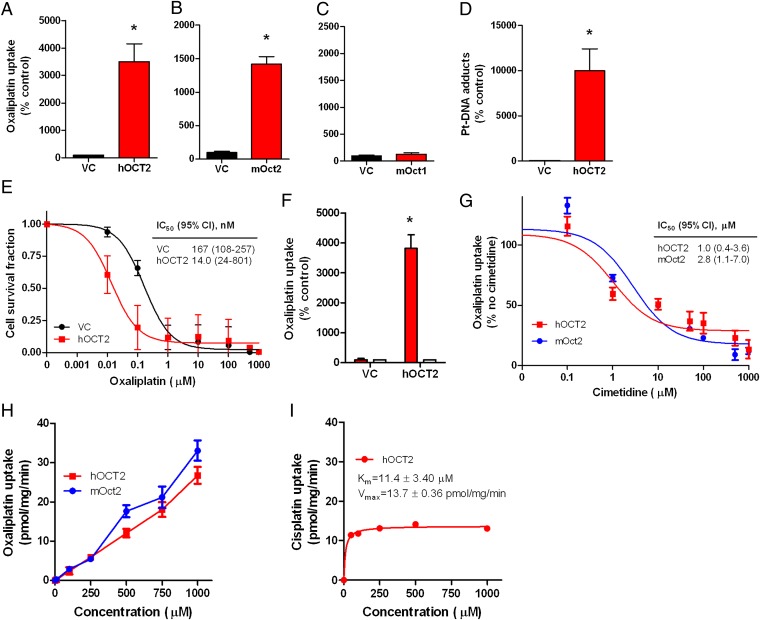
Fig. 1.
Human and murine OCT2 expression as a mediator of oxaliplatin uptake and cytotoxicity. (A–C) Transport of oxaliplatin by human OCT2 (hOCT2) (A) mouse Oct2 (mOct2) (B) and mouse Oct1 (mOct1) (C) transfected in HEK293 cells (500 µM; 30-min incubations). (D) Platinum (Pt)-DNA adduct formation in HEK293 cells transfected with hOCT2 following exposure to oxaliplatin (500 µM; 30-min incubations). (E) Cell growth inhibition induced by various concentrations of oxaliplatin in HEK293 cells transfected with hOCT2 or VC. The inset shows the estimated concentration associated with 50% growth inhibition (IC50) and the associated 95% confidence intervals (95% CIs). (F) Inhibition of cellular uptake of oxaliplatin (500 µM; 30-min incubations) with cimetidine (1 mM; white bars) in transfected HEK293 cells. (G) Inhibition of 14C-oxaliplatin (2 µM) uptake with various concentrations of cimetidine in HEK293 cells transfected with hOCT2 or mOct2 (30-min incubations). The inset shows the estimated concentration associated with 50% inhibition of uptake (IC50) and the associated 95% CIs. (H) Concentration-dependence of oxaliplatin transport by mOct2 and hOCT2 transfected into HEK293 cells. (I) Concentration-dependence of cisplatin transport by hOCT2 transfected into HEK293 cells (16). Data represent the net difference in uptake observed in cells with or without the transporter. Km denotes the Michaelis–Menten constant, and Vmax denotes the maximum velocity. Data represent the mean of triplicate observations from experiments performed on at least three separate occasions, and are expressed as average percentage of uptake values in cells transfected with an empty vector (VC). Error bars represent SE. The asterisk denotes significant differences from VC (P < 0.05).

