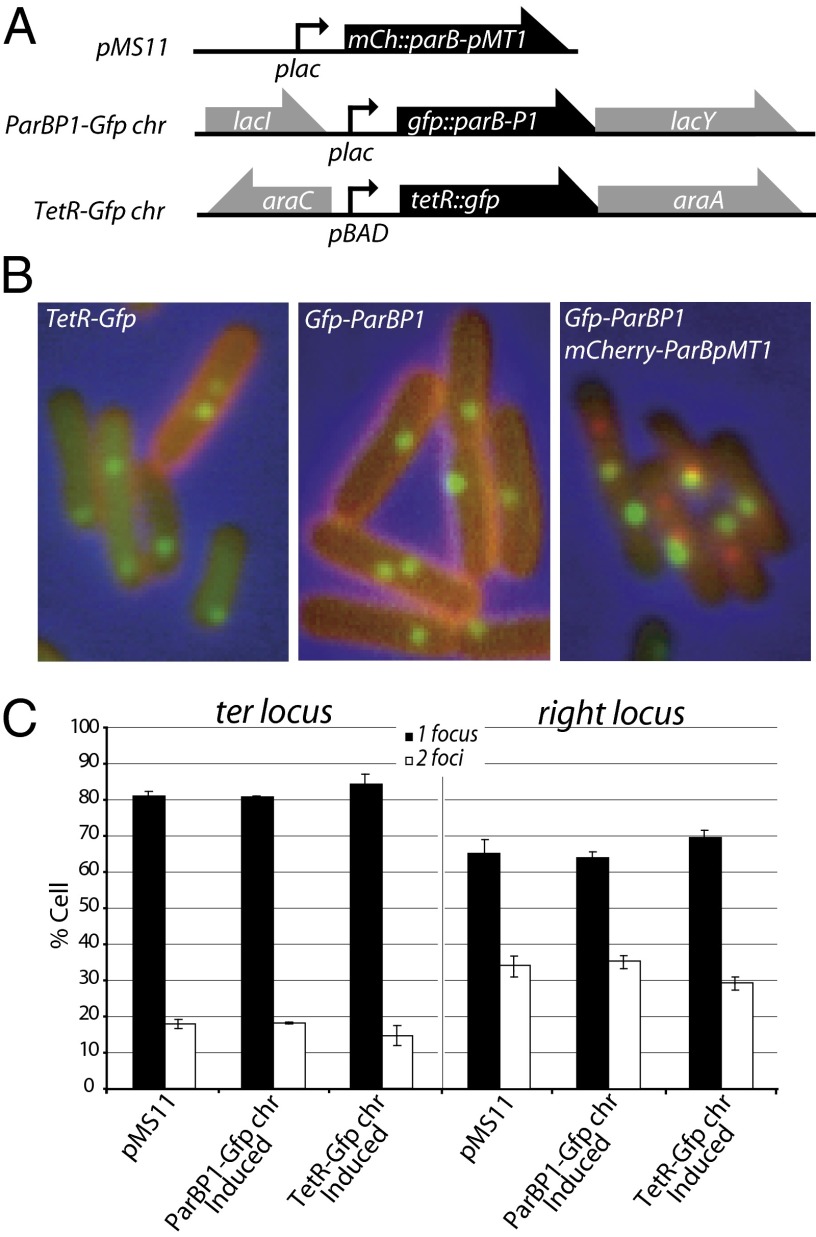
Fig. 1.
Systems used for visualization of chromosome loci. (A) Relevant map of constructs for fluorescent protein production. Plasmid pMS11 is a pSC101 derivative carrying a lacZp-mCherry-Δ30ParBP1 construct. GFP-Δ23ParBpMT1 and TetR-GFP were produced from chromosome-borne constructs at the lac and ara loci, respectively. (B) Examples of micrographs showing foci of the indicated fluorescent proteins in strains containing loci tagged with the relevant binding sites (ydgJ::tetO or parSP1; ydcB::parSP1, and ydeU::parSpMT1). (C) The percentage of cells with a single focus or two foci of the ydgJ (ter) or ydhJ (right) loci when visualized using fluorescent proteins produced from constructs shown in A.

