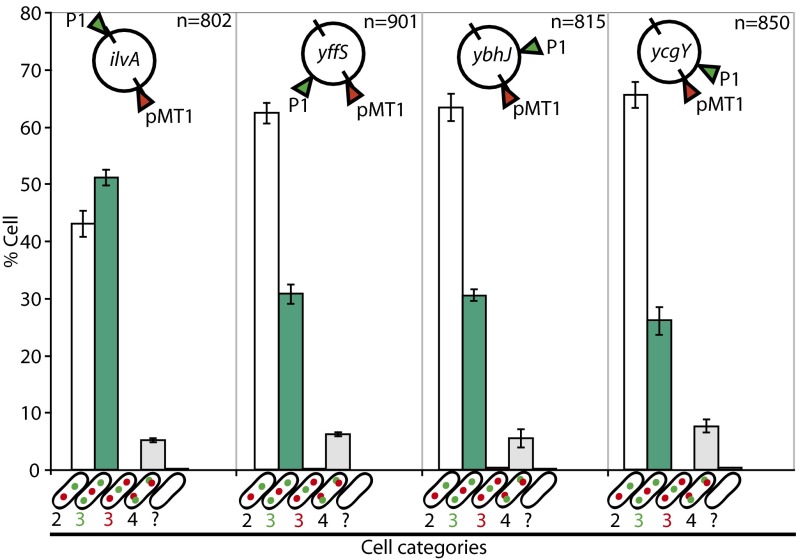
Fig. 2.
The ori-to-ter segregation of the chromosome. The ydeU locus was tagged using the ParBpMT1 system (red arrowhead),and other loci, indicated inside the chromosome maps, were tagged with the ParBP1 system (green arrowheads). Positions of loci on the chromosome are indicated by lines representing ori (top) and dif (bottom). The number of cells analyzed is given (n). Cells were classified by the number of foci of each locus (shown in cartoons on the x-axis; the empty cell indicates cells that fall in none of the first four categories). Bars show the mean percentage of each category in the population (y-axis) with individual measured ranges. Data reflect at least two independent experiments.

