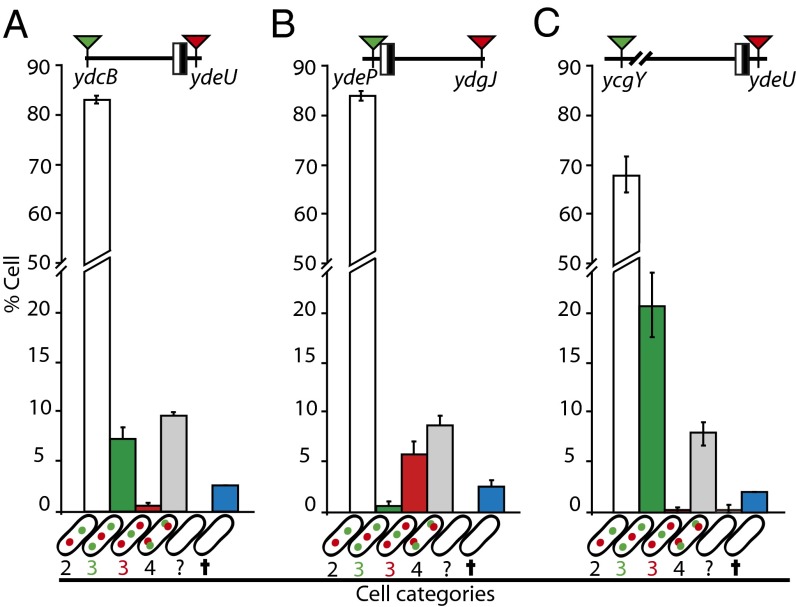
Fig. 4.
Segregation of ter in recA− strains. (A–C) Tagged loci are indicated in their position relative to dif (the black and white box). Red arrowheads indicate a parSpMT1 tag, and green arrowheads indicate a parSP1 tag. Cells were classified by the number of foci of each locus (shown in cartoons on the x-axis; the empty cell indicate cells that fall in none of the first four categories; blue bars indicate dead cells, see also Fig. S6). Bars show the mean percentage of each category in the population (y-axis) with individual measured ranges. Data reflect at least two independent experiments and 600 cells.

