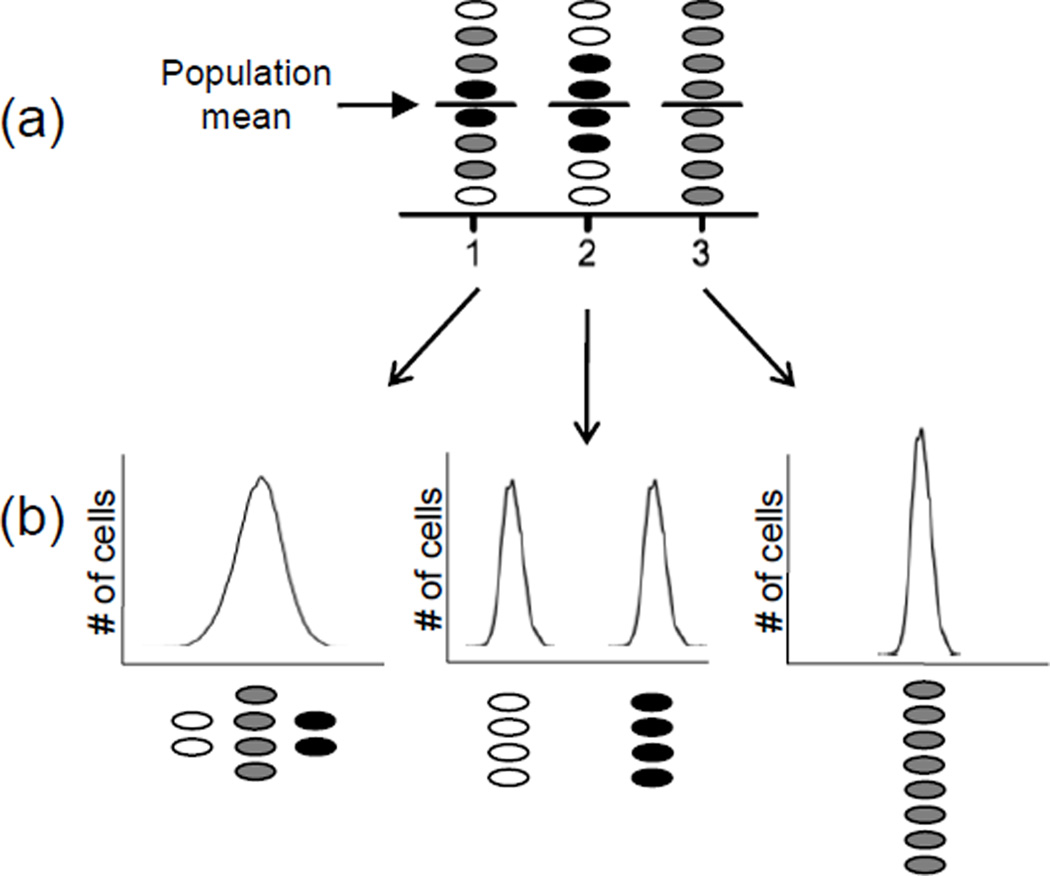
Figure 1. Surprises lurk within averaged data sets.
Colors represent cells with low (white), medium (gray) and high (black) levels of the measured parameter. (a) Bulk culture experimental techniques such as Western blots and β-galactosidase assays measure the average of a parameter across an entire population, but equal means may characterize very different populations as indicated by the different shading. (b) Single-cell analysis techniques such as flow cytometry or microscopy generate a more complete picture of the diversity that may be concealed by averaging.

