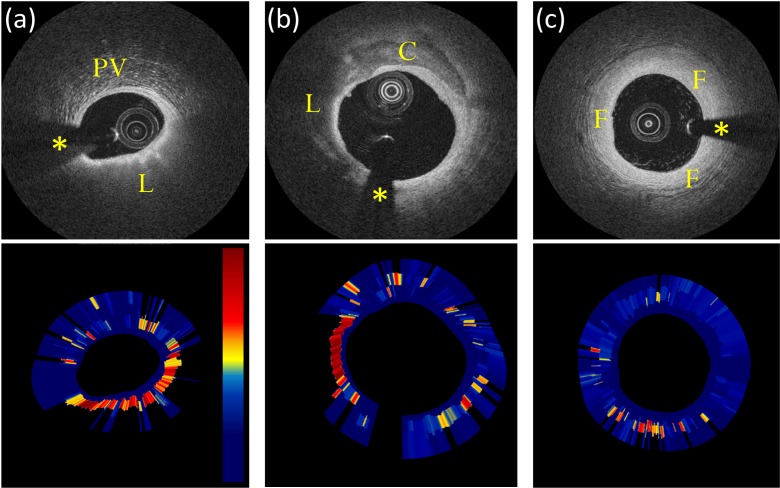
Fig. 5.
Attenuation imaging examples. Image (a) contains a lipid-rich plaque (L) and peri-vascular tissue (PV). Image (b) contains a mixed atherosclerotic plaque containing both lipid-rich (L) and calcific (C) tissue; image (c) shows an example of intimal thickening (fibrotic tissue). Automatic analysis correctly depicts lipid-rich tissue with a higher attenuation coefficient. Attenuation images µt(d) are displayed on a color scale from 0 (dark blue) to 12 mm−1 (dark red). Asterisks indicate the guide-wire shadowing artifact.

