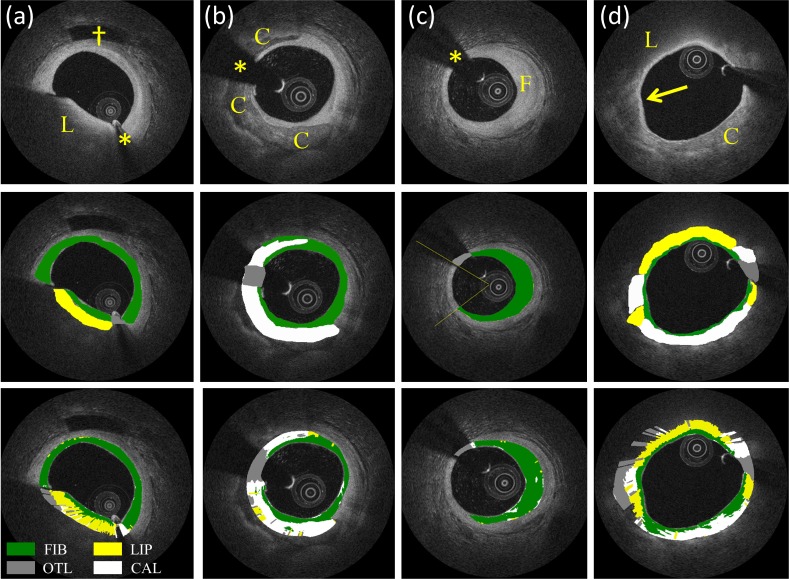
Fig. 6.
Classification examples. Image (a) shows an example of lipid-rich tissue (L); image (b) a calcified plaque (C); image (c) a fibrotic plaque (F); image (d) a mixed plaque containing both calcific and lipid-rich tissues (arrow). From the images it is possible to appreciate automated characterization of the 3 main plaque components and outliers (last row) by comparing to ground truth (manual analysis - middle row). Asterisks indicate guide-wire shadowing artifact and (†) indicates a side-branch. Color coding: yellow = lipid-rich, green = fibrotic, white = calcific and gray = outliers.

