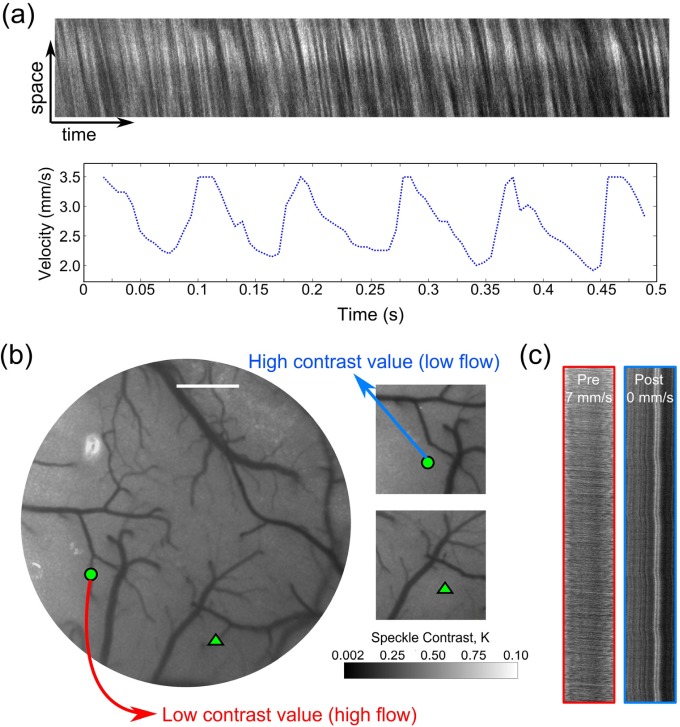
Fig. 2.
(a) Two-photon linescan from a cortical arteriole and calculated RBC speed time-course. (b) Laser Speckle Contrast Imaging of cortical flow before and after occlusion. Images shown are real-time computed speckle contrast images (5ms exposure duration) using a 7x7 pixel window, where darker pixel intensities indicate higher flow. Green circle and triangle indicate two arterioles selected for occlusion. Scale bar = 400 µm. (c) Linescans taken from Arteriole 1 (circle) are shown pre- and post-occlusion. See Media 2 (4.7MB, MOV) for real-time LSCI during photothrombosis. Intermediary halo of lower contrast around targeted vessel video are saturation artifacts of the excitation light used for photothrombosis.

