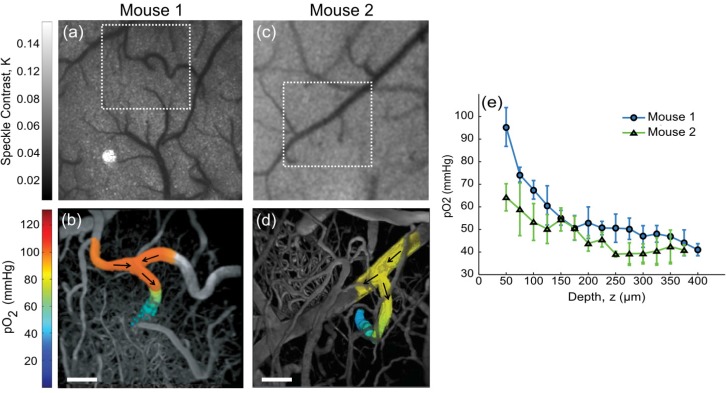
Fig. 3.
Speckle contrast images of cortical flow from Mouse 1 (a) and Mouse 2 (c). Baseline pO2 in descending arterioles. Projections of three-dimensional vascular imaging to a depth of 400 µm (b) and 375 µm (d) with pO2 measurements taken in the arterioles of Mouse 1 and 2, respectively. Arrows indicate flow direction. Scale bar = 50 µm. See Media 3 (22.2MB, MOV) for three-dimensional views of Mouse 1. (e) Baseline pO2 depth profile in descending arterioles from (b) and (d). First measurements (z = 50 µm) correspond to initial descent points. Data and error bars represent avg +/− s.d. over five measurements.

