Fig. 4.
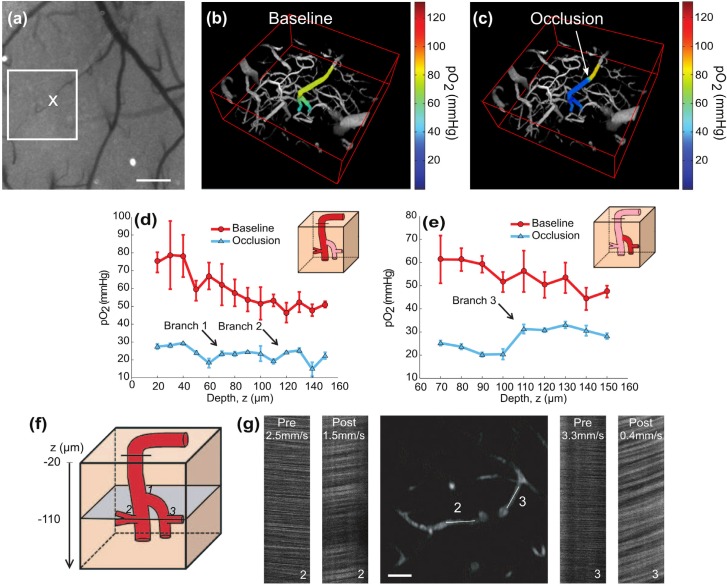
Targeted occlusion of an arteriole and resulting changes in oxygen tension and blood flow. (a) Baseline speckle contrast image. Two-photon imaging region is boxed and 'X' denotes photothrombosis location. Scale bar = 200 µm. (b) Baseline (Media 4 (33.3MB, MOV) ) and (c) post-occlusion (Media 5 (39.2MB, MOV) ) pO2 maps in descending arteriole. pO2 gradient downstream of occlusion significantly differs with baseline (p<002, repeated measures ANOVA). See Media 6 (549.5KB, PDF) for selected pial measurements and linescans. pO2 depth profile under baseline and post-occlusion conditions in the (d) primary descending arteriole and in a (e) secondary descending segment. Arrows denote branch points. Error bars represent avg +/− s.d. over five measurements. (f) Cartoon depicting branch points from (d) and (e) and imaging plane selection at a depth of 110 µm for (g) two-photon image and linescans in the enumerated branches. Scale bar = 25 µm.

