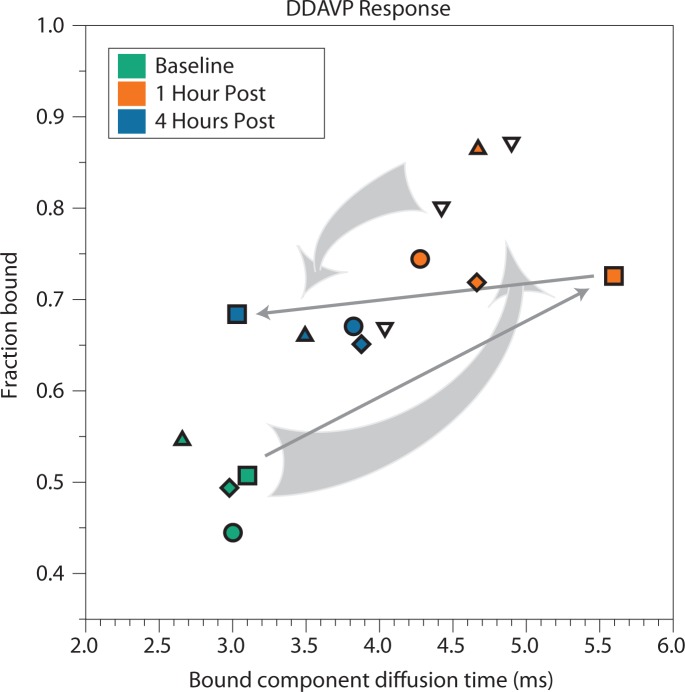
Fig. 5.
Analysis of patient response to DDAVP. Two-component fitting gives a measure of antigen level as well as average multimer size. Each symbol shape corresponds to a different patient, while the colors indicate the time the sample was taken (green: prior to DDAVP administration; orange: 1 hour post administration; blue: four hours post administration). Arrows illustrate the time course of selected patients. Dark gray arrows highlight one patient with an anomalous response. One set of samples, with an elevated initial bound fraction, is shown uncolored for visual clarity.

