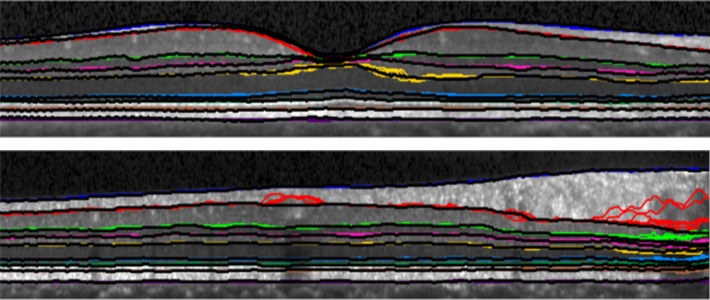
Fig. 9.
Two B-scan images from two different subjects are shown with the resulting boundaries from each of the 10 cross-validation runs overlaid. Each boundary is represented by a different color with the manual delineation shown atop the other boundaries in black. Therefore, if the color is not visible at a particular point, the automatic and manual segmentation are in agreement.

