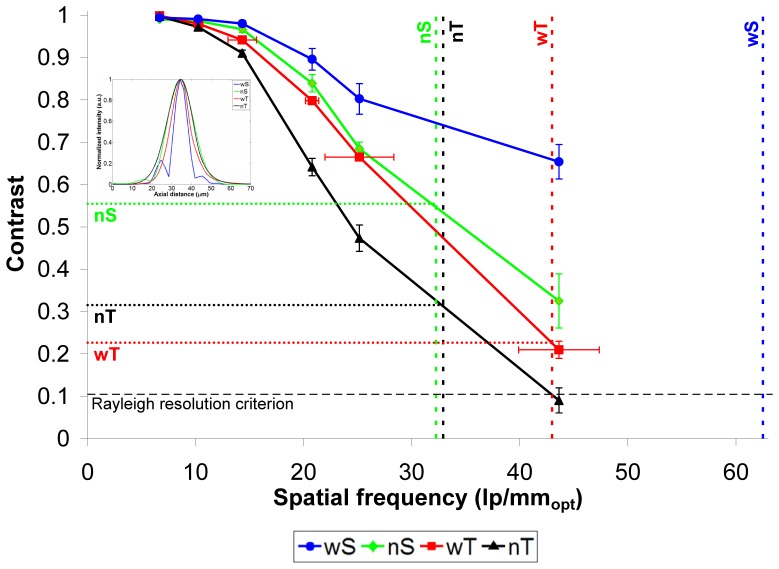
Fig. 5.
CTF curves for the four OCT configurations. Error bars represent the standard deviation of each data point. Horizontal error bars are shown only on the wT curve for clarity; they are the same for all curves. Vertical dashed lines indicate the equivalent spatial frequency to the FWHM of each configuration’s axial PSF. Inset shows axial PSFs for the four OCT configurations (wS: wideband SDOCT, nS: narrowband SDOCT, wT: wideband TDOCT, nT: narrowband TDOCT).

