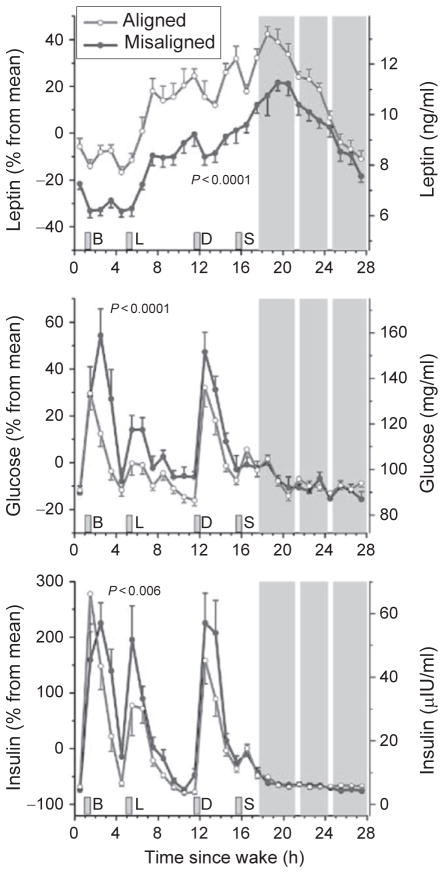
Fig. 4.
The response of circulating levels of leptin, glucose, and insulin to circadian misalignment. Data are reported relative to each participant’s average values during circadian alignment on the left axes and in absolute values on the right axes. Error bars represent standard error of the mean. Gray area indicates the participant’s sleep opportunity. The white strips within the scheduled sleep opportunity represent when participants were briefly awoken to perform pulmonary function tests. B, breakfast; L, lunch; D, dinner; S, snack. Reproduced with permission from Scheer et al. (2009).

