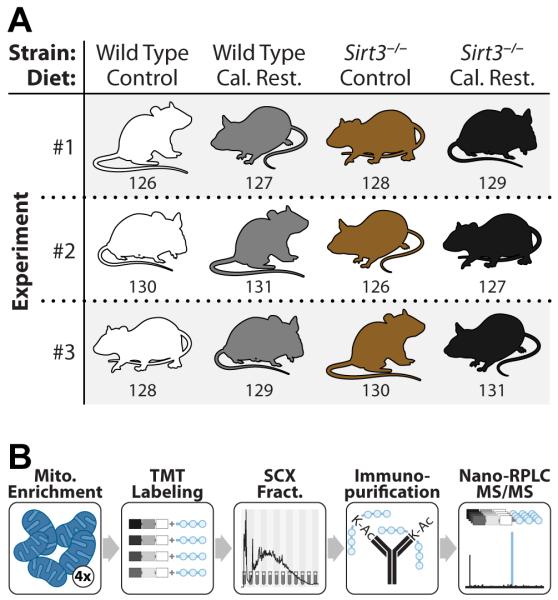
Figure 1. Experimental design and mass spectrometry workflow for quantitation of acetylated mitochondrial proteins between four biological conditions.
(A) WT and Sirt3−/− mouse liver mitochondria were compared in biological triplicate from mice fed either the control or calorie restricted (CR) diet. Numbers correspond to the isobaric mass tag used for that sample.
(B) Extracted protein from purified liver mitochondria was trypsin digested followed by labeling with TMT reagents. Labeled peptides were combined and fractionated by strong cation exchange chromatography. Each fraction was enriched for acetyl peptides with a pan anti-acetyl lysine antibody and analyzed via nano-RPLC-MS/MS. See also Figure S3.

