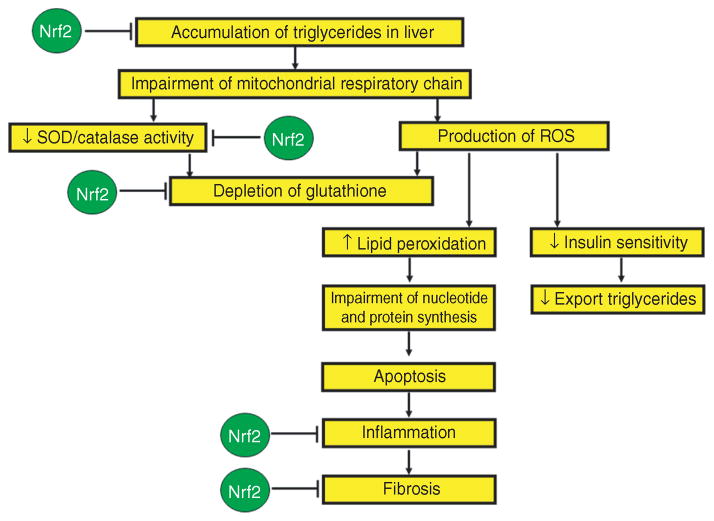
Figure 2.
A schematic representation of the changes that occur during the development of NAFLD/NASH (shown in yellow boxes) from the initial accumulation of triglycerides in the liver to the inflammation and fibrosis that would be seen in steatohepatitis. In addition, this schematic depicts the areas in which Nrf2 activation may positively affect this pathway and prevent the development and/or progression of this disease (shown in green circles). These deductions are based on many findings from the literature cited in the text of this review. NAFLD, nonalcoholic fatty liver disease; NASH, nonalcoholic steatohepatitis; Nrf2, nuclear erythroid 2–related factor 2; ROS, reactive oxygen species; SOD, superoxide dismutase.

