
Fig. 4.
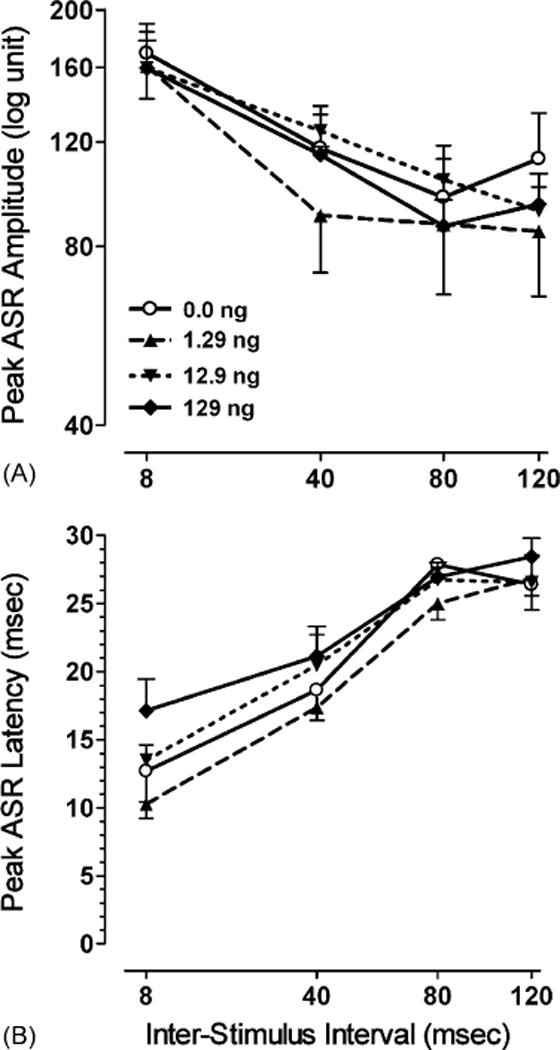
Mean (±S.E.M.) for each of the four treatment groups across PPI trials (8–120 ms ISIs) illustrating (A) peak ASR amplitude, and (B) peak ASR latency.
Official websites use .gov
A
.gov website belongs to an official
government organization in the United States.
Secure .gov websites use HTTPS
A lock (
) or https:// means you've safely
connected to the .gov website. Share sensitive
information only on official, secure websites.
Mean (±S.E.M.) for each of the four treatment groups across PPI trials (8–120 ms ISIs) illustrating (A) peak ASR amplitude, and (B) peak ASR latency.