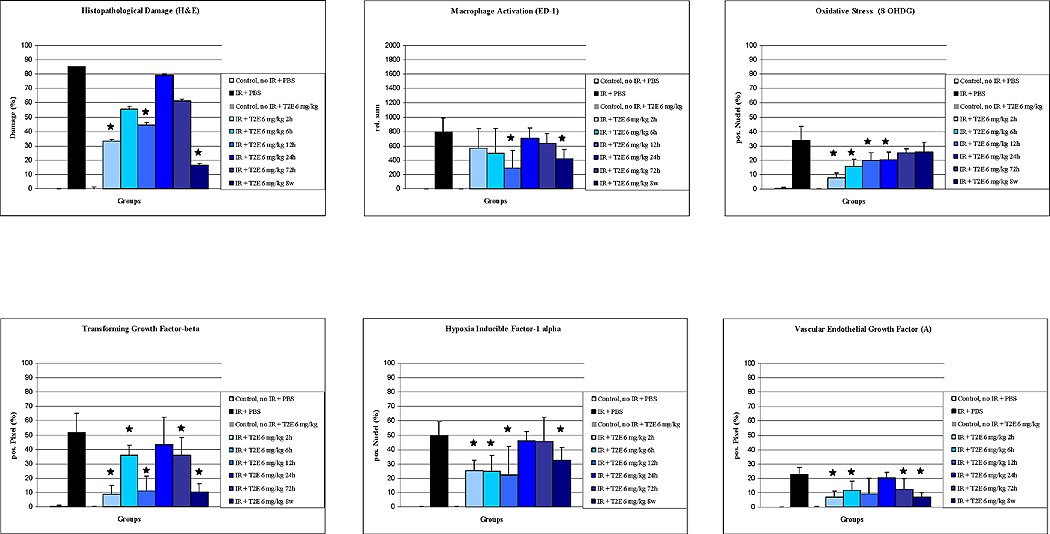
Figure 2.
Comparison of experimental groups on histopathological damage, macrophage activation (ED-1), oxidative stress (8-OHdG), transforming growth factor-β (TGF-β), hypoxia inducible factor-1α (HIF-1α), and vascular endothelial growth factor (A) (VEGF(A)). Results are displayed as vertical bar plots with standard deviation. Asterixes indicate statistical significant differences between IR-only group and IR + MnP treatment groups (p < 0.05).

