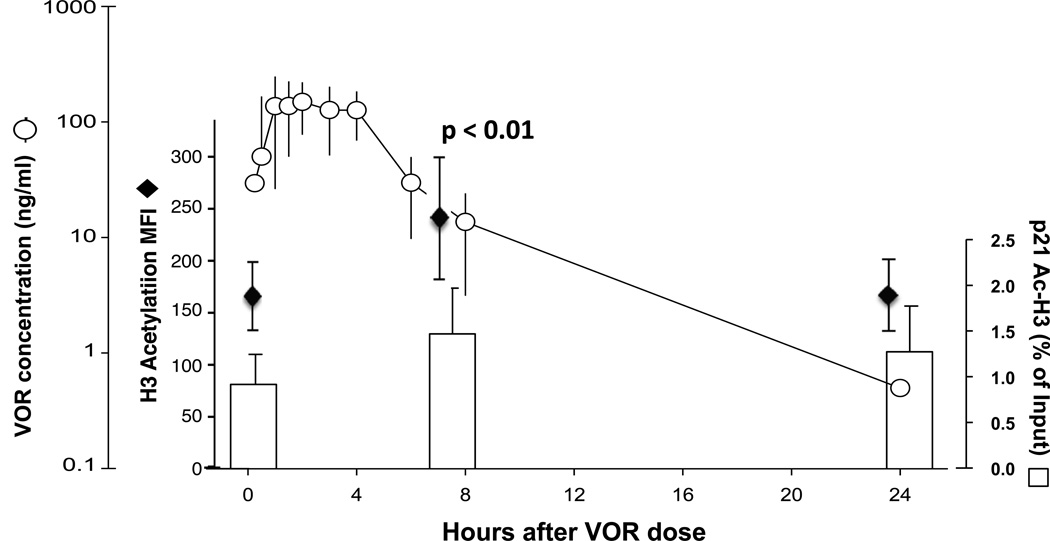
Figure 2. VOR exposure and histone acetylation.
Median VOR plasma concentrations in patients 1–8 after a single 400 mg oral dose (circles with range shown) is shown in comparison to mean total cellular acetylated histone H3 in PBMCs (diamonds with s.d. shown), and relative levels of acetylated histone H3 at the human p21 gene promoter in resting CD4+ T cells (bars, mean and s.d.). A significant increase (†) in cellular acetylated histone H3 is seen at 8 hours, p < 0.01. A trend towards increased acetylation at the p21 gene is seen in the patients (2–5, 7) in whom sufficient cells were available for analysis.

