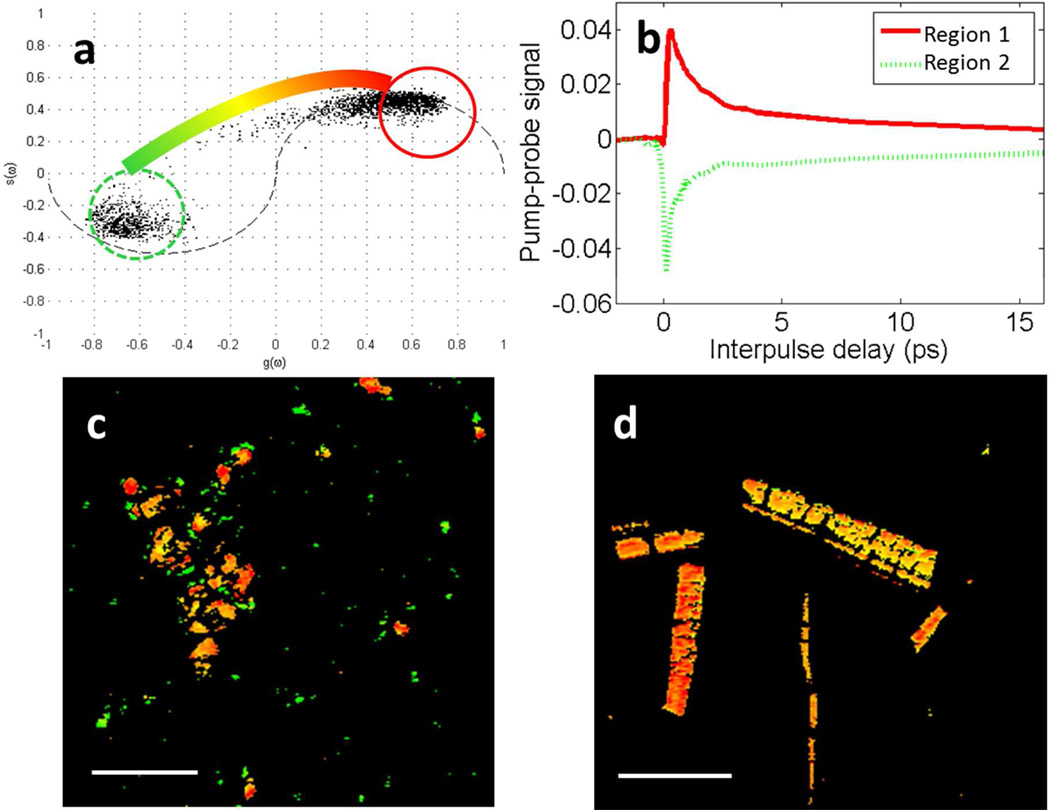
Figure 2.
a.) Phasor plot showing clusters of pixels with similar response in the unpurified fossil eumelanin. The color bar shows the color scheme used for pump-probe images, where pixels falling into the circles are colored accordingly, and pixels between those circles are interpolated to a shade in between. b.) Averaged pixels in corresponding regions of the phasor plot. c.) Pump-probe image of the fossil eumelanin on a glass slide with pixels colored according to the phasor color scheme. Scale bar = 100 µm. d.) Pump-probe image of purified S. officinalis eumelanin on a glass slide with pixels colored according to the phasor color scheme. Scale bar = 100 µm.

