Figure 4.
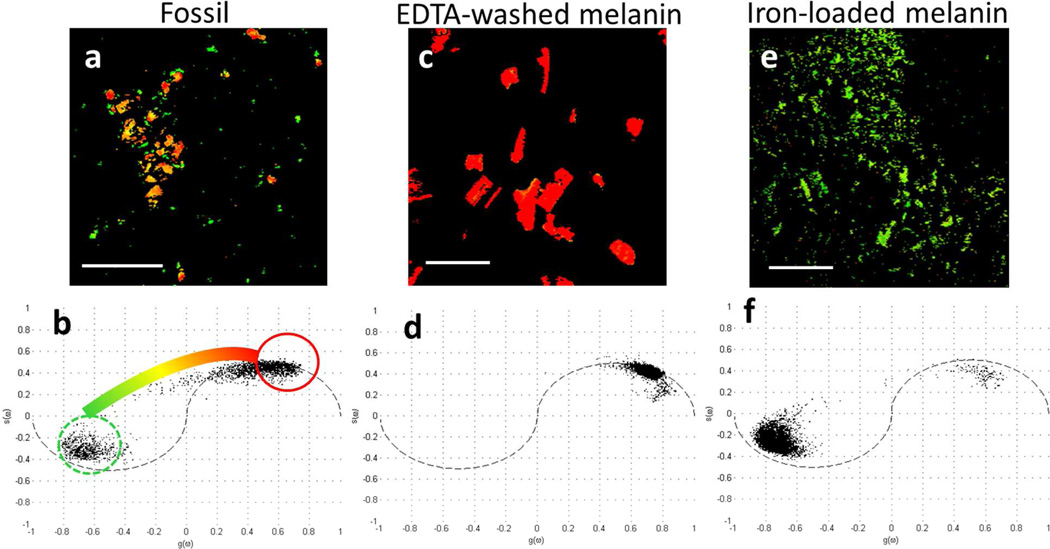
a.) Pump-probe image of the fossil eumelanin with phasor color scheme. Scale bar is 100 µm. b.) Phasor plot of pixels in the imaged fossil, showing the color scheme used for the images. c.) Pump-probe image of S. officinalis eumelanin washed with EDTA. Scale bar is 100 µm. d.) Phasor plot of pixels in the imaged EDTA-washed S. officinalis eumelanin. e.) Pump-probe image of S. officinalis eumelanin washed with EDTA, then loaded with iron(III) chloride. Scale bar is 100 µm. f.) Phasor plot of pixels in the imaged iron loaded EDTA-washed S. officinalis eumelanin.

