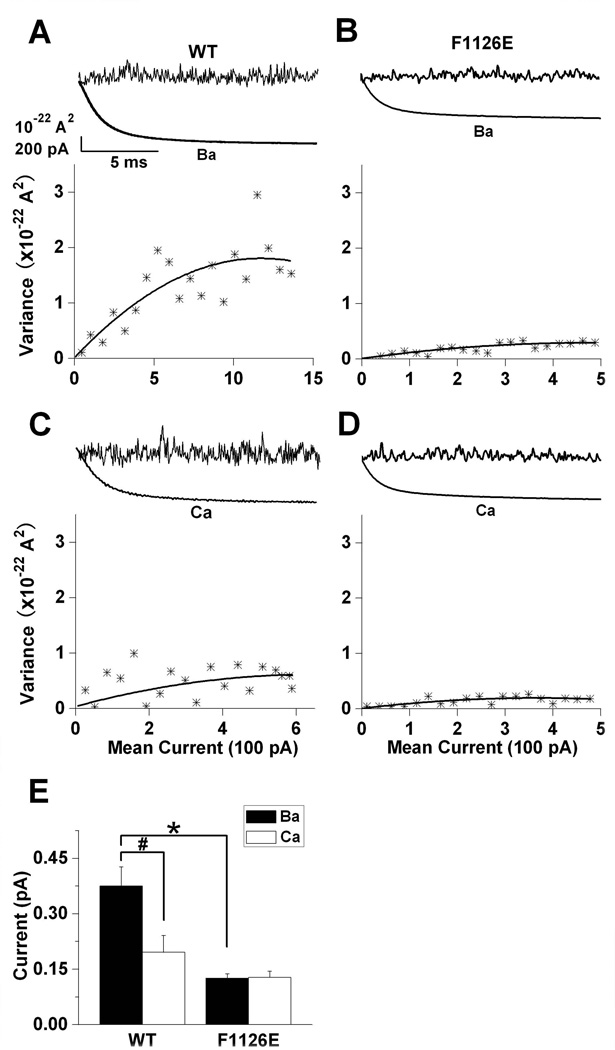
Fig. 4. F1126E reduces the unitary current amplitude in Ba2+ to match that in Ca2+.
Ba2+ (A and B) and Ca2+ (C and D) currents for wild-type and F1126E were evoked by a series of 100 voltage steps (15 msec) to 0 mV from a holding potential of −120 mV. Data were analyzed using PULSETOOLS nonstationary noise analysis software to acquire the variance and mean current of each cell (A–D, upper traces). Variance-mean current relationships (A–D, lower graphs) were fit with the equation σ2 = i × I − I2/N − σb2, where σ2 is the variance, σb2 the baseline variance or background noise, i the unitary current amplitude, I the mean current and N the number of active channels: wild-type (Ba2+), i = 0.290 ± 0.019 pA, Po = 53.8 ± 6.1%, n = 7; wild-type (Ca2+), i = 0.159 ± 0.033 pA, Po = 48.4 ± 11.6%, n = 7; F1126E (Ba2+), i = 0.126 ± 0.012 pA, Po = 42.8 ± 11.6%, n = 6; F1126E (Ca2+), i = 0.128 ± 0.017 pA, Po = 66.9 ± 9.6%, n = 7. (E) Mean unitary current amplitudes are plotted for wild-type and F1126E.

