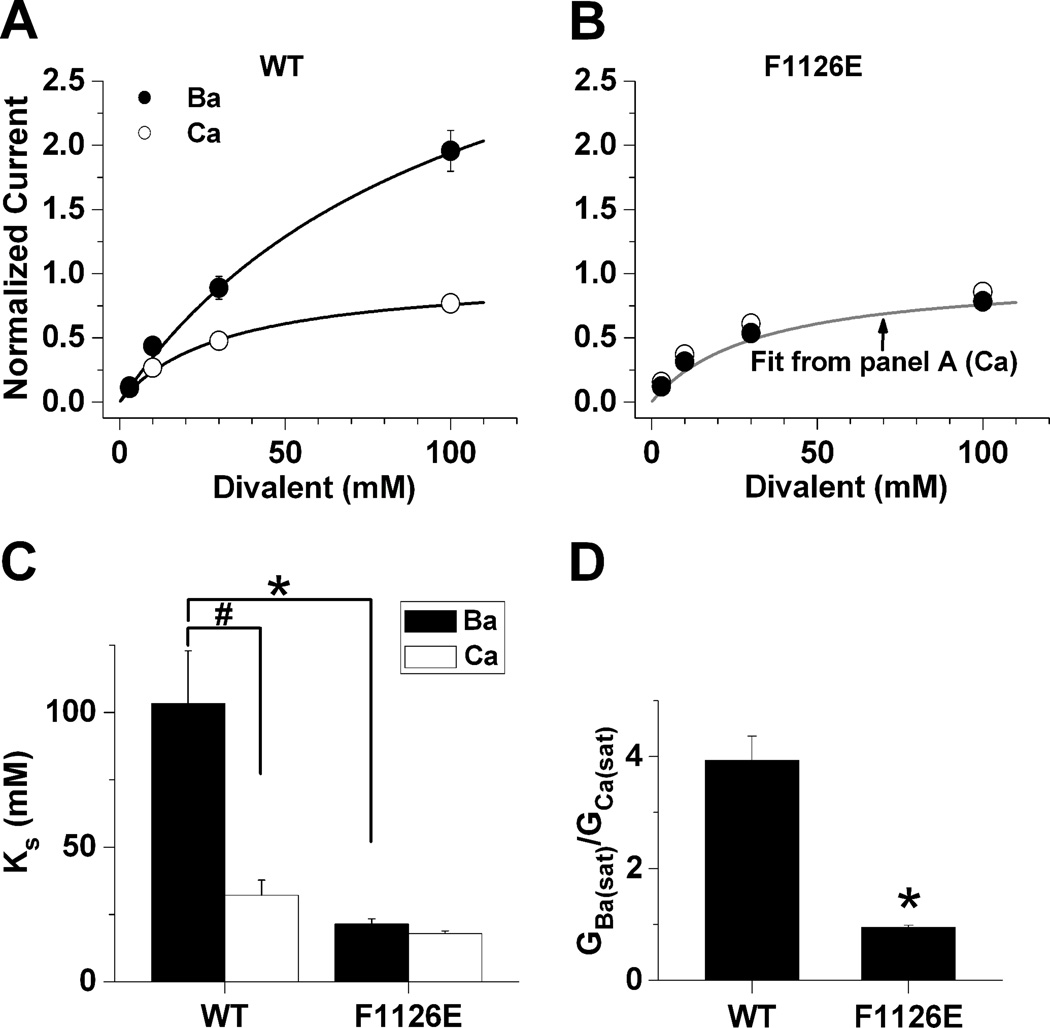
Fig. 9. F1126E alters the relationship between saturating and conductance of Ba2+.
Peak tail-currents were recorded at 0 mV following 20 msec depolarizing steps to +70 mV, to maximally activate wild-type (A) or F1126E (B) in Ba2+ and Ca2+. Tail-currents were measured in 3, 10, 30 and 100 mM Ba2+ and Ca2+ from the same cell. Data were normalized to GCa(sat) and fit by the Michaelis-Menton equation, G = Gsat/(1 + (KS/c)), where Gsat is the level of current at saturating concentrations of divalent cations, c is the concentration of divalent cation, and KS is the divalent cation concentration that produces one-half Gsat. The fit for wild-type (Ca2+) is shown in panel B (gray). GBa(sat) (nS), wild-type, 9.2 ± 2.9 (n = 5); F1126E, 3.6 ± 0.7 (n = 6); GCa(sat): wild-type, 2.7 ± 1.3; F1126E, 3.7 ± 0.6. (C) KS values in mM are plotted for wild-type and F1126E in Ba2+ and Ca2+. (D) Data are plotted as GBa(sat)/GCa(sat) for wild-type and F1126E.

