
Figure 2.
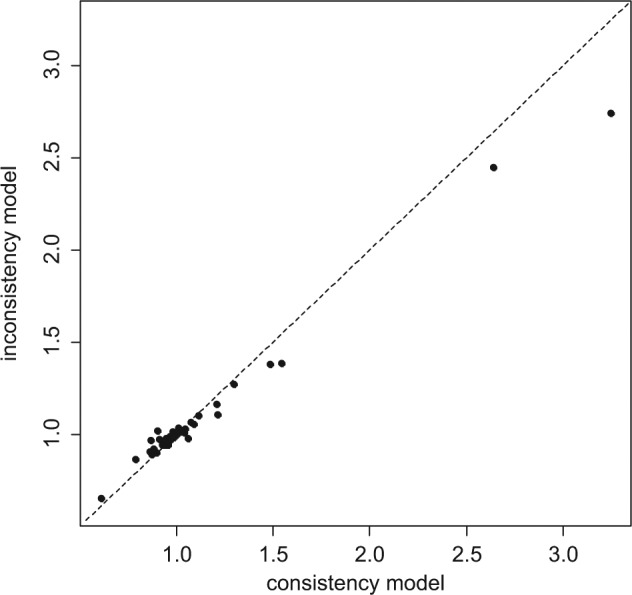
Plot of the individual data points’ posterior mean deviance contributions for the consistency model (horizontal axis) and the unrelated mean effects model (vertical axis) along with the line of equality.
Official websites use .gov
A
.gov website belongs to an official
government organization in the United States.
Secure .gov websites use HTTPS
A lock (
) or https:// means you've safely
connected to the .gov website. Share sensitive
information only on official, secure websites.
Plot of the individual data points’ posterior mean deviance contributions for the consistency model (horizontal axis) and the unrelated mean effects model (vertical axis) along with the line of equality.