
Figure 4.
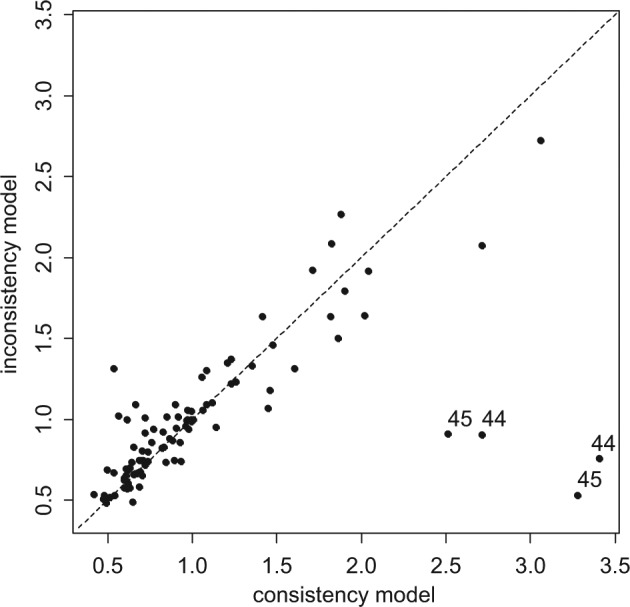
Plot of the individual data points’ posterior mean deviance contributions for the consistency model (horizontal axis) and the unrelated mean effects model (vertical axis) along with the line of equality. Points that have a better fit in the unrelated mean effects model have been marked with the trial number.