Fig. 4.
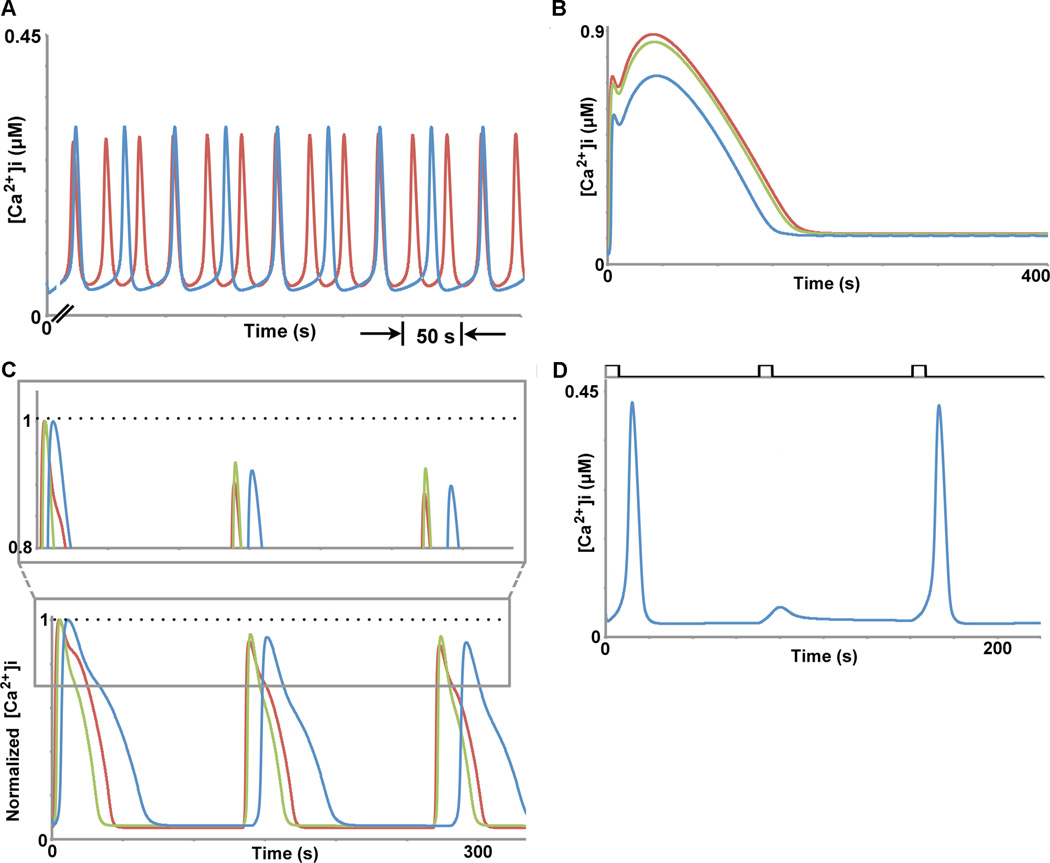
Behaviors of the enhanced mathematical model that includes receptor phosphorylation dynamics. A) With continuous low ligand concentration stimulation, the model exhibits calcium oscillations whose frequency increases with increasing ligand concentrations (blue = 5 nM, red = 10 nM). B) With continuous high ligand concentration stimulation, the model exhibits acute responses, whose amplitude increases and then saturates with increasing ligand concentrations (blue = 100 nM, green = 500 nM, red = 10 µM). C) Our enhanced model can also qualitatively capture the response of calcium under the periodic stimulation conditions presented in Table 1. Red trace: C = 500 nM, D = 6 s, TR = 128 s; blue trace: C = 100 nM, D = 6 s, TR = 64 s; green trace: C = 100 nM, D = 6 s, TR = 128 s. The grey boxed area is shown in more detail above the full simulation to accentuate the differences in amplitude between each of the periodic stimulation conditions mentioned above. Times and amplitudes have been normalized to enable easy visual comparison, as in Fig. 2c. D) The enhanced model produces phase-locked calcium signals and sub-threshold spikes upon periodic stimulation, as observed experimentally (12, 17). Periodic stimulation conditions used here were: C = 10 nM, D = 6 s, TR = 64 s (black pattern above the calcium traces).

