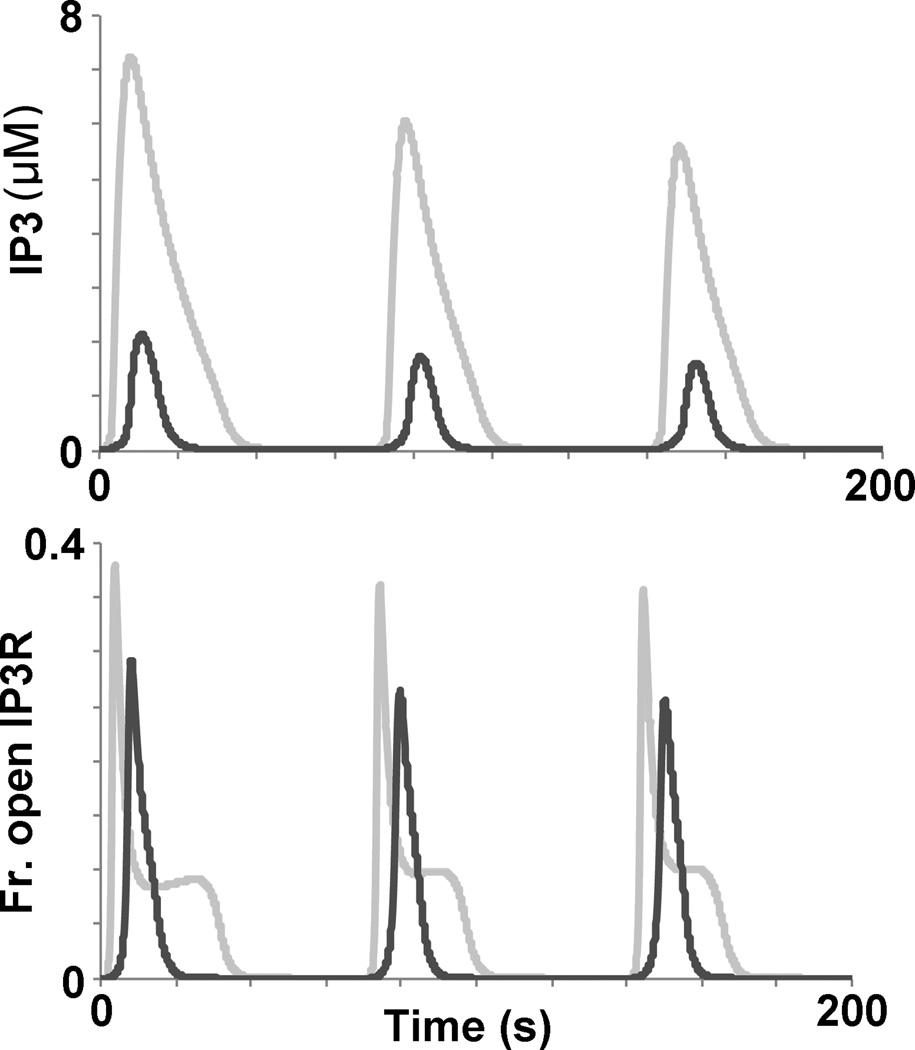
Fig. 6.
IP3 levels and the fraction of “open” IP3 receptors provide insight into the activation dynamics of the acute (light gray trace) and oscillatory (dark gray trace) regimes as revealed by periodic stimulation in silico. Top: IP3 levels are dramatically higher for the acute regime compared to the oscillatory regime. Bottom: The fraction of “open” IP3 receptors is greater for the acute regime compared to the oscillatory regime. Periodic stimulation conditions: C = 15 nM (oscillatory) 100 nM (acute), D = 6 s, TR = 64 s.

