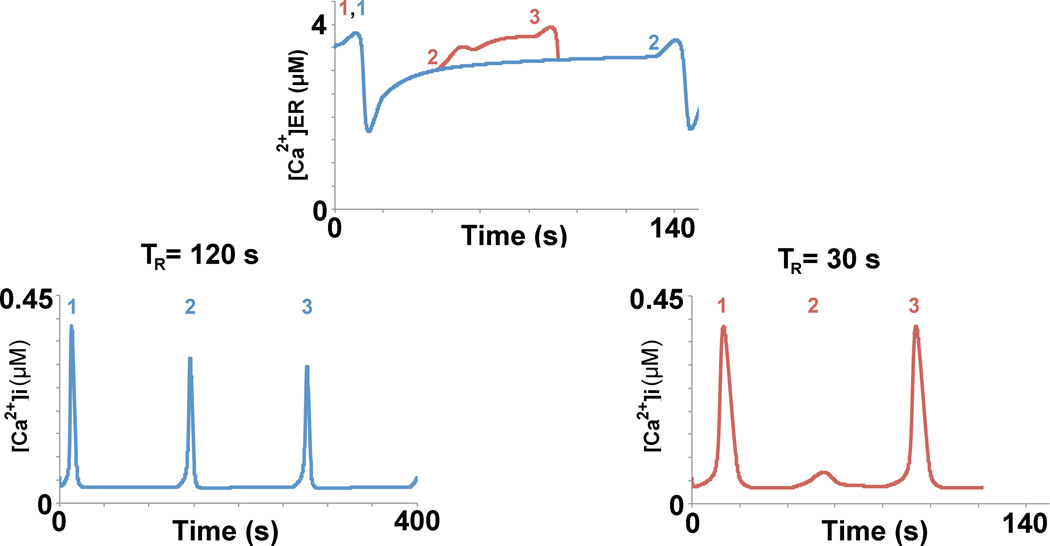
Fig. 7.
With greater recovery time, ER calcium levels can replenish to a greater extent. The colored numbers above the ER calcium traces represent the time points at which a stimulation event occurred for TR = 30 s (red) and TR = 120 s (blue). When the recovery TR = 30 s, there is not enough ER calcium to provide a full calcium signal, a subthreshold spike results (red ‘2’); after the subthreshold spike, the ER calcium continues to replenish to a sufficient level, at which time the third stimulation event arrives, resulting in a full calcium signal (red ‘3’). When TR is extended to 120 s from 30 s, the ER calcium levels are allowed to fill to a level that is sufficient for eliciting a full calcium signal (blue ‘2’, blue ‘3’ is not depicted in the ER calcium graph).

