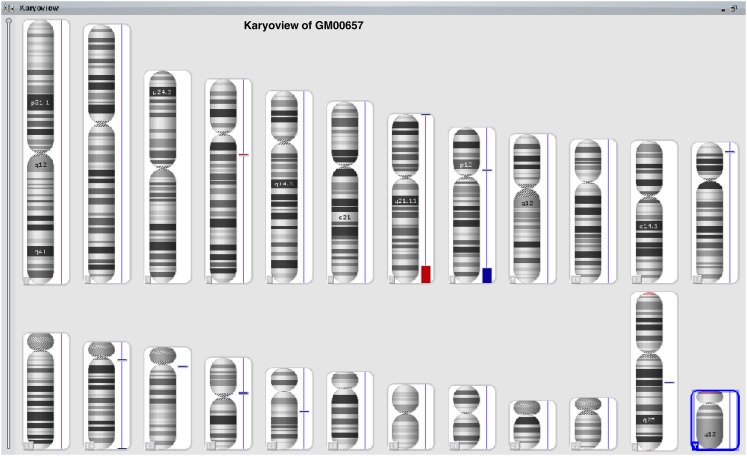
Figure 4.
Example of Karyoview of CMA analysis of GM00657. The karyoview presents a diagram of all CNVs (red bar for loss; blue bar for gain) and AOH (purple bar, if present) on the whole genome of the cell line tested. The size of each bar usually reflects the size of the CNV and/or AOH proportionally. The major CNVs in this case are the loss of distal 7q and the gain of distal 8q. Although the chromosomes 18 are involved in structural rearrangement with both chromosomes 7 and 8 as detected by karyotype and FISH analyses, but CMA analysis did not detect a CNV on the chromosomes 18.

